

I'll be attaching a spreadsheet with the blog so you can add it to your toolkit, as well as follow the case study below better. You can find the spreadsheet here with all the figures broken down.
Startup TAM SAM SOM Framework by @FrankFlitton
Everyone has a cool app idea and every programmer I know has an “Ideas” folder filled with unreleased startup ideas.
How do you know if its any good?
If you've ever attended some pitch deck competitions you might hear the panel of VC judges say that the “idea isn't big enough” or “we're not sure if it will sell”. This is an even larger hurdle to get past if you are pre-sales or pre-revenue working on raising a seed round.
Understanding your Total Addressable Market (TAM), Serviceable Available Market (SAM), and Serviceable Obtainable Market (SOM) allows you to have those conversations in a way that paints that scale and can get potential partners interested in ways they can help you grow.
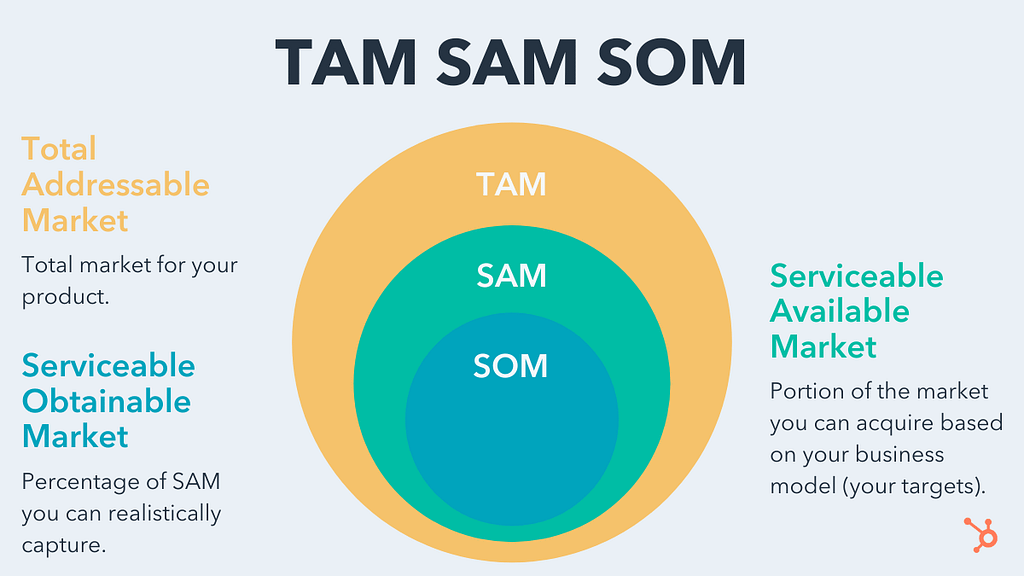
Diagram of TAM SAM SOM from Hubspot
Like most things in sales, you can take a top-down approach and build a funnel to demonstrate your TAM, SAM, and SOM.
- TAM: The market demand for your startup
- SAM: A segment of the TAM. Usually defined by some demographic data that defines your ideal user persona.
- SOM: This is the “niche” your startup will occupy. Think of this as your sales goal. You'll know you need to brach out to different sectors, geographies, etc. as you trend towards this number.
A tough pill to swallow for me was that a startup needs sales, you need to build something that will sell. It may not need to be profitable Day One but you need to know there's actually “market” with “demand” for the solution you're building. For the sake of the conversation, let's define the terms Demand and Market.
- “Market” is the amount of money each year that potential customers spend.
- “Demand” is the number of sales (or users) per year that are your potential customers.

Photo by Firmbee.com on Unsplash
But I don't have sales? How can I have a Service Obtainable Market?
That's just it, you don't need sales to have this figure. It's the amount of that market you think you can obtain. Often you can use public info found on Wikipedia or a Google search to get this info. You can use it to establish the current market is trending up or down and other insights around your market.
For seed/pre-revenue don't sweat the dollars and cents. You're trying to make a Venn diagram to illustrate the opportunity size.
- Assume everything is year over year.
- Use as recent numbers as possible.
Try to answer questions like:
- How large is the opportunity?
- Does the business have the ability to scale to billions of dollars?
- How much “of the pie” can you expect to scale up to despite competitors? etc.
To illustrate what all this means, let's use a case study with real numbers. All of these sources where gleamed from one Google search using the top 4 results for “how many dogs are sold in Australia” and a bit of reading. A lot of articles are USA-centric, so let's change it up for an added challenge. All figured are presented in Australian Dollars.
Case Study: App For New Dog Owners in Australia
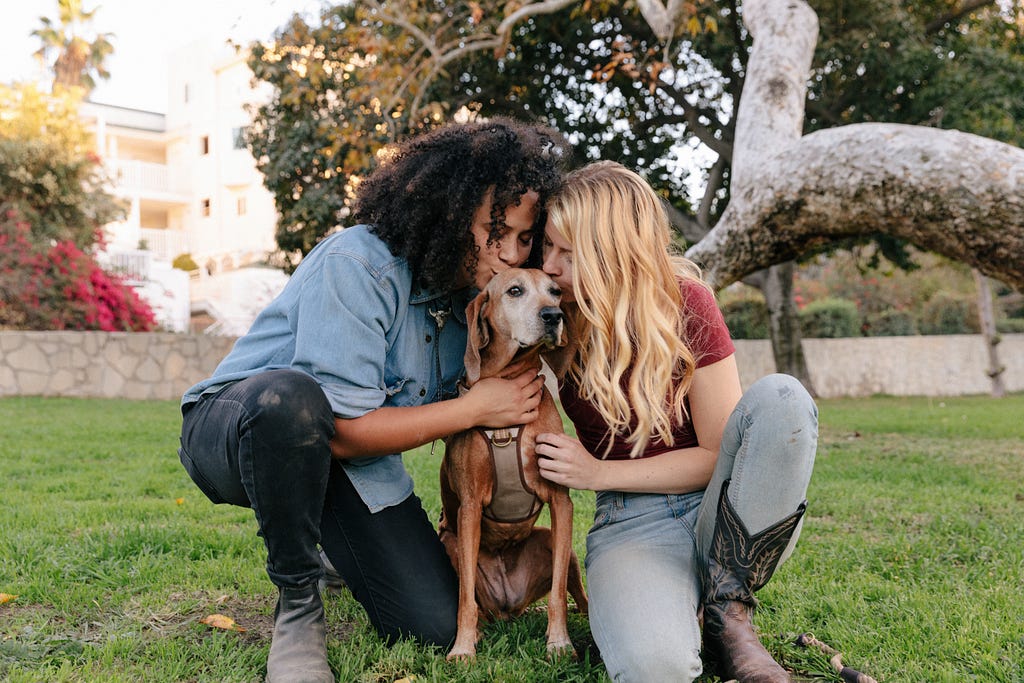
Photo by courtney coles on Unsplash
Our hypothetical app wants to help dog owners by directing them to ethical and vet recommended breeders and services when shopping for a new puppy and get everything set up for the new pooch. The best-of-breed service is launching in Australia, as that's where the founding team is based.
To put it simply: the unit economics of the business depends on the number of dogs per year sold. Every X dogs is Y $M.
Here's a spreadsheet to help us follow the math below as we drill down to the startup's SOM.
Startup TAM SAM SOM Framework by @FrankFlitton
Let's plan our funnel a bit:
- TAM: all dogs sold (in Australia)
- SAM: those dogs that are sold online
- SOM: dogs sold online through a breeder
TAM
450,000 dogs are sold in Australia every year [1]. The average sale was $1,700. Apparently 45% of Australian households own dogs. [3, 4]
450K dogs/yr * $1,700/dog = $778M.
Congrats, we have a $778M/yr market of dog purchases to swim in.
SAM
Let's say 90**%** of non-puppy mill sales are done online or through social media each year. It seems like ~25% of dogs are obtained for free or from a brick and mortar store. [2, 4]
This would be 90% of 75% of TAM.
90% online sales of (450K dogs/yr—%25 free dogs) = 303,750 dogs sold online/yr
There are 303,750 dogs/yr in our SAM of breeders and shelters or $516M/yr in new dog sales within our SAM.
SOM
29% of all dogs are obtained are through breeders and around 7% through shelters. [4]
29% breeders + 7% shelters of ($516M) = 109K dogs/yr or $185M/yr
This feels a little high to me for a best-of-breed service. We can specify the a niche market we're serving further. Though, it would be impressive to build up to capturing all those different types of customers and dogs.
Let's refine the SOM further by specifying that the startup is targeting focusing on people buying “pure breed” and “designer breed” dogs.
These dogs are more likely to be purchased though a vet or breeder, so there are some pre-existing consumer trends and motivations to build upon. An urban persona earning more than $100,000/yr comprises at least 40% of “pure breed” dogs and “designer breed” dog buyers. Focusing on these pure and designer breeds of dogs allows us to focus the startup a 61% of the dogs within the service addressable market. [4]
40% income of 61% of fancy dogs of ($185M) = 26K dogs/yr or $45M/yr
A SOM of $45M of sales seems reasonable from the top-line TAM of $778M. Now, that $45M is not profits. It's hinting at the amount of revenue that will flow through the market within this clear segment. You can track your market share overtime and if you've saturated your potential customers.
These “new dog sales” SOM numbers can be dialed in to help find market fit and, ultimately, reach your business goals as you define your market segment and competition more.
✨ Time for some magic numbers! ✨
New Dog Sales Business Model
Our startup has two missions: connecting people with ethical breeders or shelters and helping end users care for their new dog. Let's look at the opportunities around connecting potential owners with these new pups.
Photo by Jametlene Reskp on Unsplash
For connecting new owners with a puppy, our startup take a 5% service fee for the transaction. We're looking at revenue $2.2M/yr with that model. That sounds like a great business.
If we did a $5 service fee per purchase you're looking at $133k/yr. That sounds like a lot of work for little reward at 100% SOM saturation.
These numbers imply very different company sizes and scope. You can see how your business model will work at scale now with the SAM vs SOM above.
Some SaaS revenue could come from other services like providing services to breeders or vets to be featured in a marketplace or other set-up costs from owning a dog etc. to build upon that $3M/yr figure and build a stronger business with more services to the users, and multiple sources of revenue too.
Other Set-up Costs For A New Dog
Building on the 26K dogs/yr in our SOM, our startup wants to provide services to these new dogs! There's a lot to do from vet visits to buying doggie gear and food.
Photo by Jamie Street on Unsplash
From some googling, it looks like new dog owners spend ~$25K over the dog's lifetime. 20% of the life time expense (~$5K) is in the first year. [5]
The first year of owning a dog “set up” expense would be $5K setup costs * 26K dogs/year = $133M/yr “dog setup” SOM.
This excludes any other ongoing expenses to owning a dog, the average spend is ~$350 ongoing year over year. [5] Yielding a potential recurring opportunity of $350 annual cost * 35K dogs/year = $9M/yr to capture in the future from existing users.
If we add them together, helping users after they purchase the dog represents a $142M/yr niche market we can service.
Conclusion
Having a great app idea is just the beginning. To turn it into a successful business, it is crucial to validate the idea by understanding your Total Addressable Market (TAM), Serviceable Available Market (SAM), and Serviceable Obtainable Market (SOM).
Building things is fun, but everything has a cost. This framework can help you communicate the potential upsides vs costs wether you're a Designer, Engineer or PM.
By using real-world numbers, projections, and market research, you can paint a clear picture of the market demand and potential size of your business. It's important to keep in mind that while projections can be helpful, they are not guarantees and should be re-evaluated as your business grows and evolves.
Ultimately, creating a product that people want and are willing to pay for is the key to building a successful startup.
References
[1]: http://leemakennels.com/blog/tag/statistics/ [2]: https://petkeen.com/puppy-mill-statistics-australia/ [3]: https://kb.rspca.org.au/knowledge-base/how-many-pets-are-there-in-australia/ [4]: https://animalmedicinesaustralia.org.au/wp-content/uploads/2022/11/AMAU008-Pet-Ownership22-Report_v1.6_WEB.pdf [5]: https://www.abc.net.au/everyday/how-much-does-it-cost-to-own-a-dog-money-diary/100402694