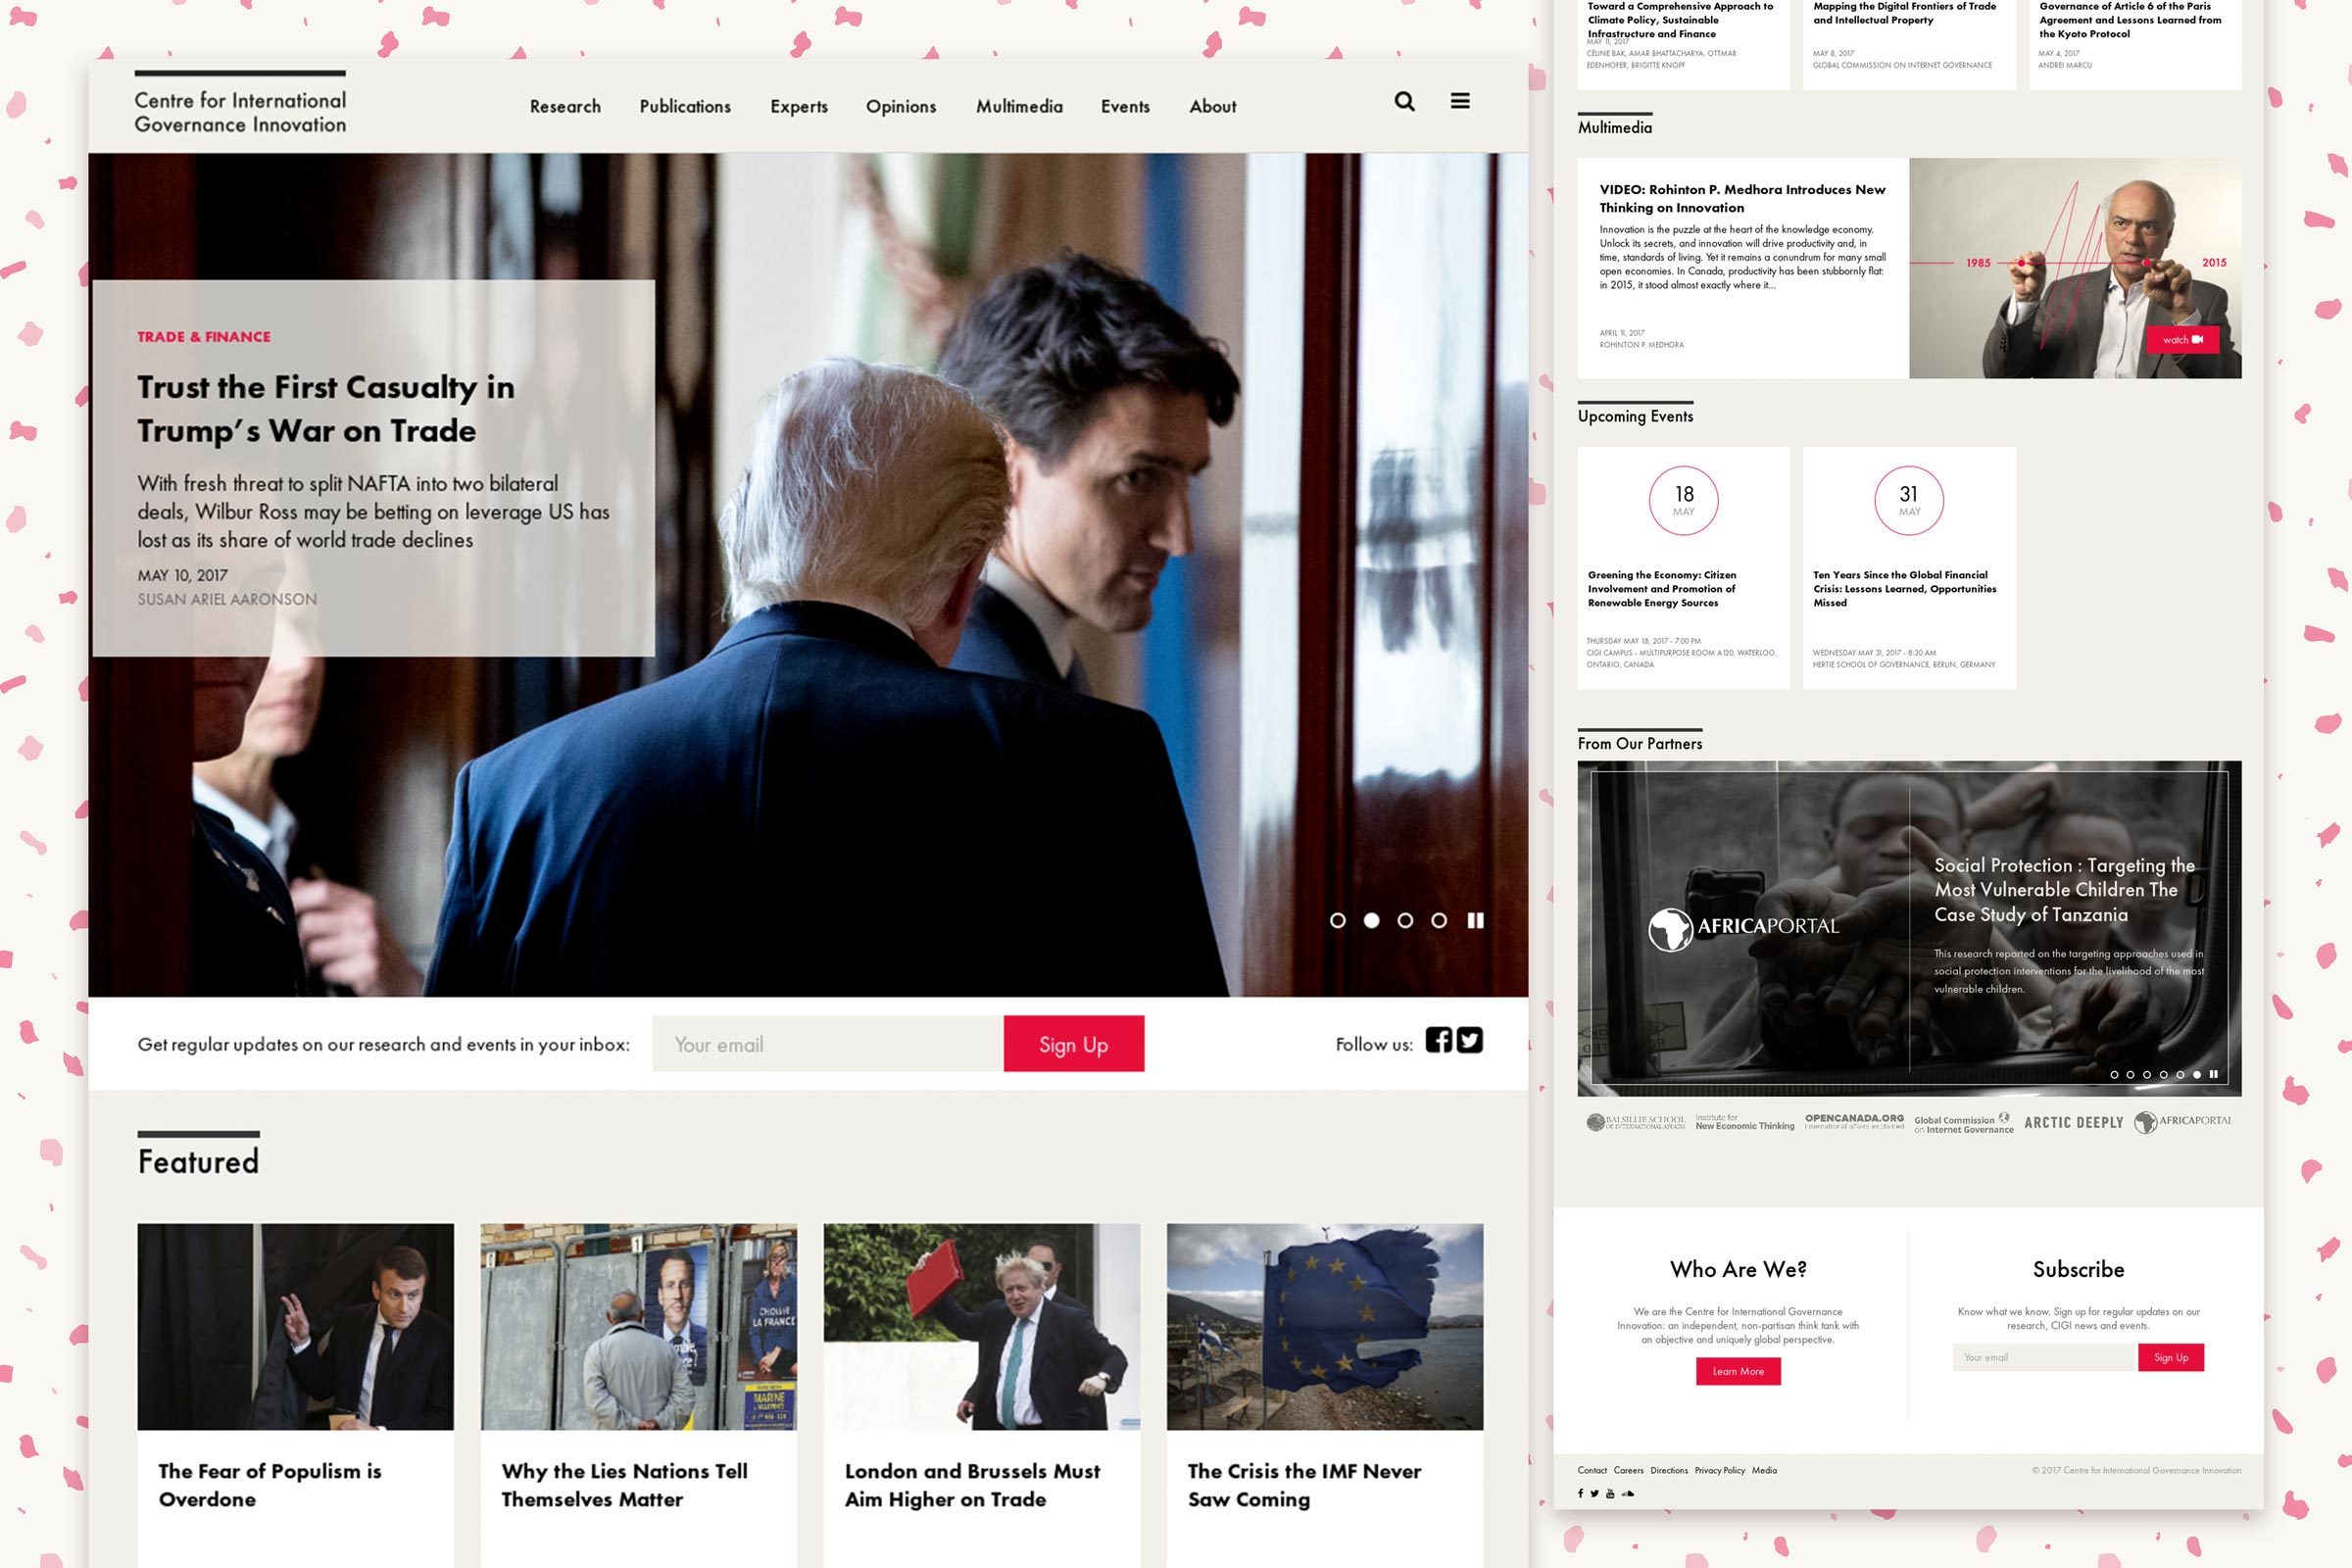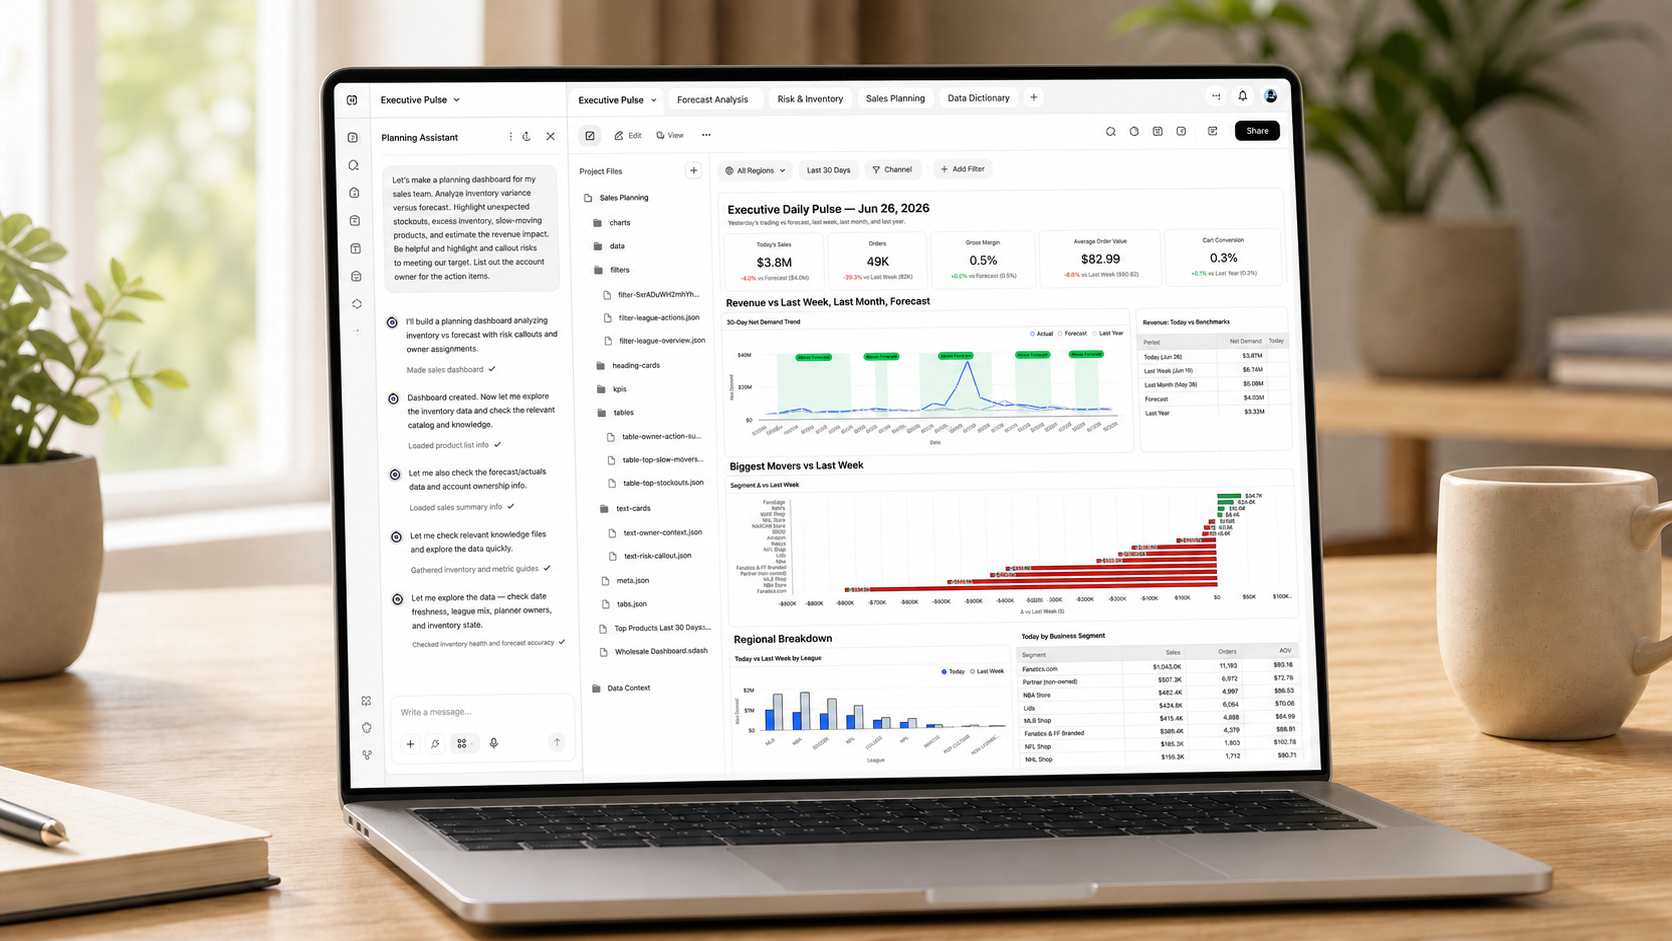
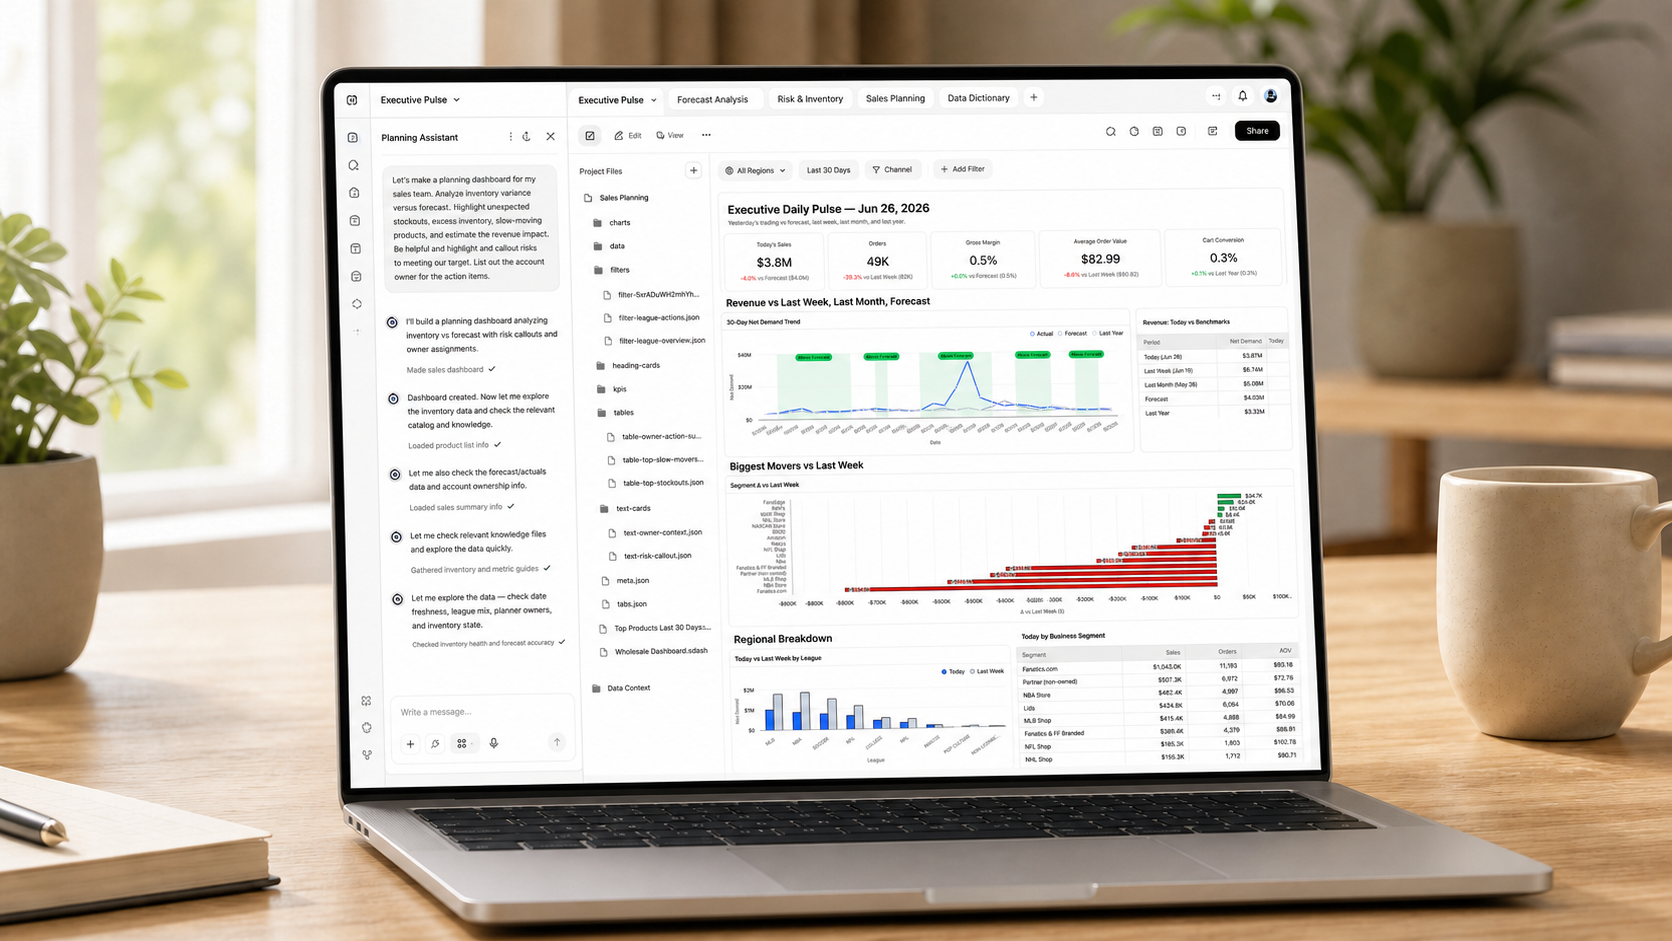
A dashboard product where an agent turns a business question into a complete, live, multi-tab analysis. Built at Summation in partnership with the Fanatics wholesale sales team.
Wholesale ops and finance teams have questions, not dashboards. Answering them normally means a BI ticket and a two-week queue. This asks the question and gets the dashboard.
Client
Summation
Category
AI Product · Data Visualization
Contributions
- Product Engineering
- Agent Orchestration
- Schema Design
- React & TypeScript
- Python Validators
- Data Visualization
- Filter Query Brokering
Project Link
The problem
Wholesale ops and finance teams have questions, not dashboards. What are my warehouse forecasting issues. Where are my top sales opportunities. Answering those normally means a BI ticket and a two-week queue, or a consulting engagement that produces a static Power BI deck and a six-figure invoice.
The product
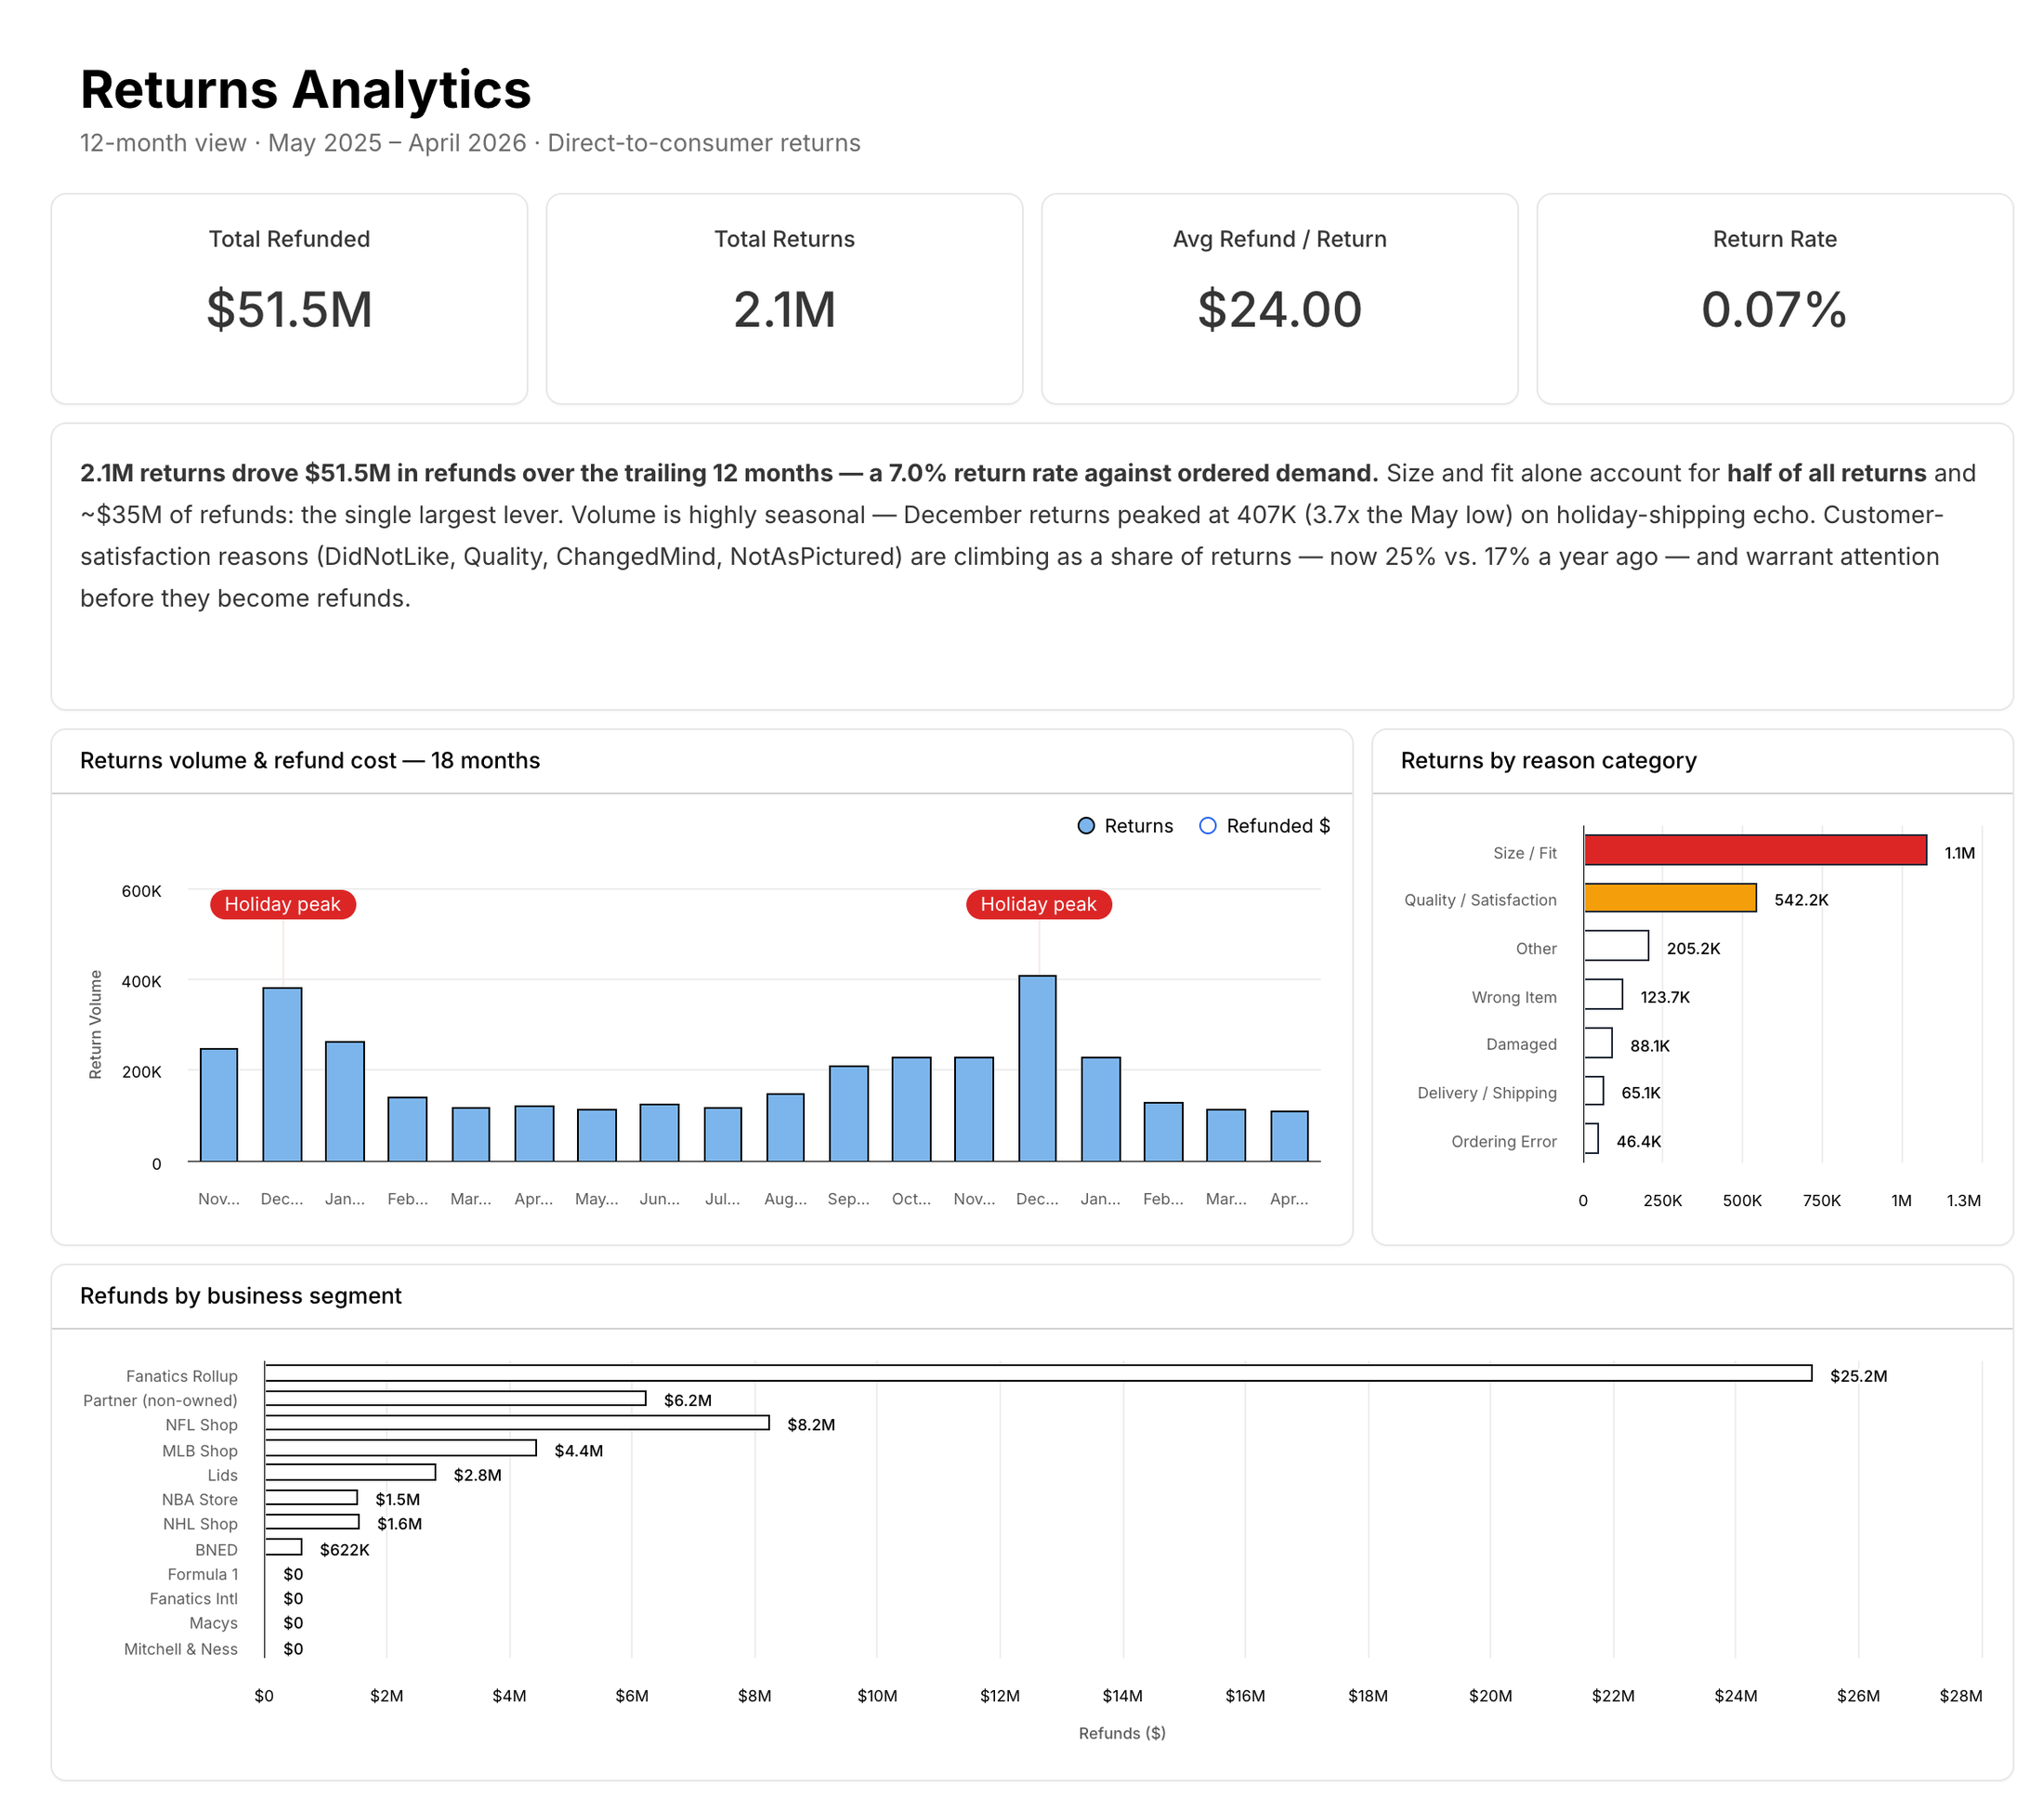
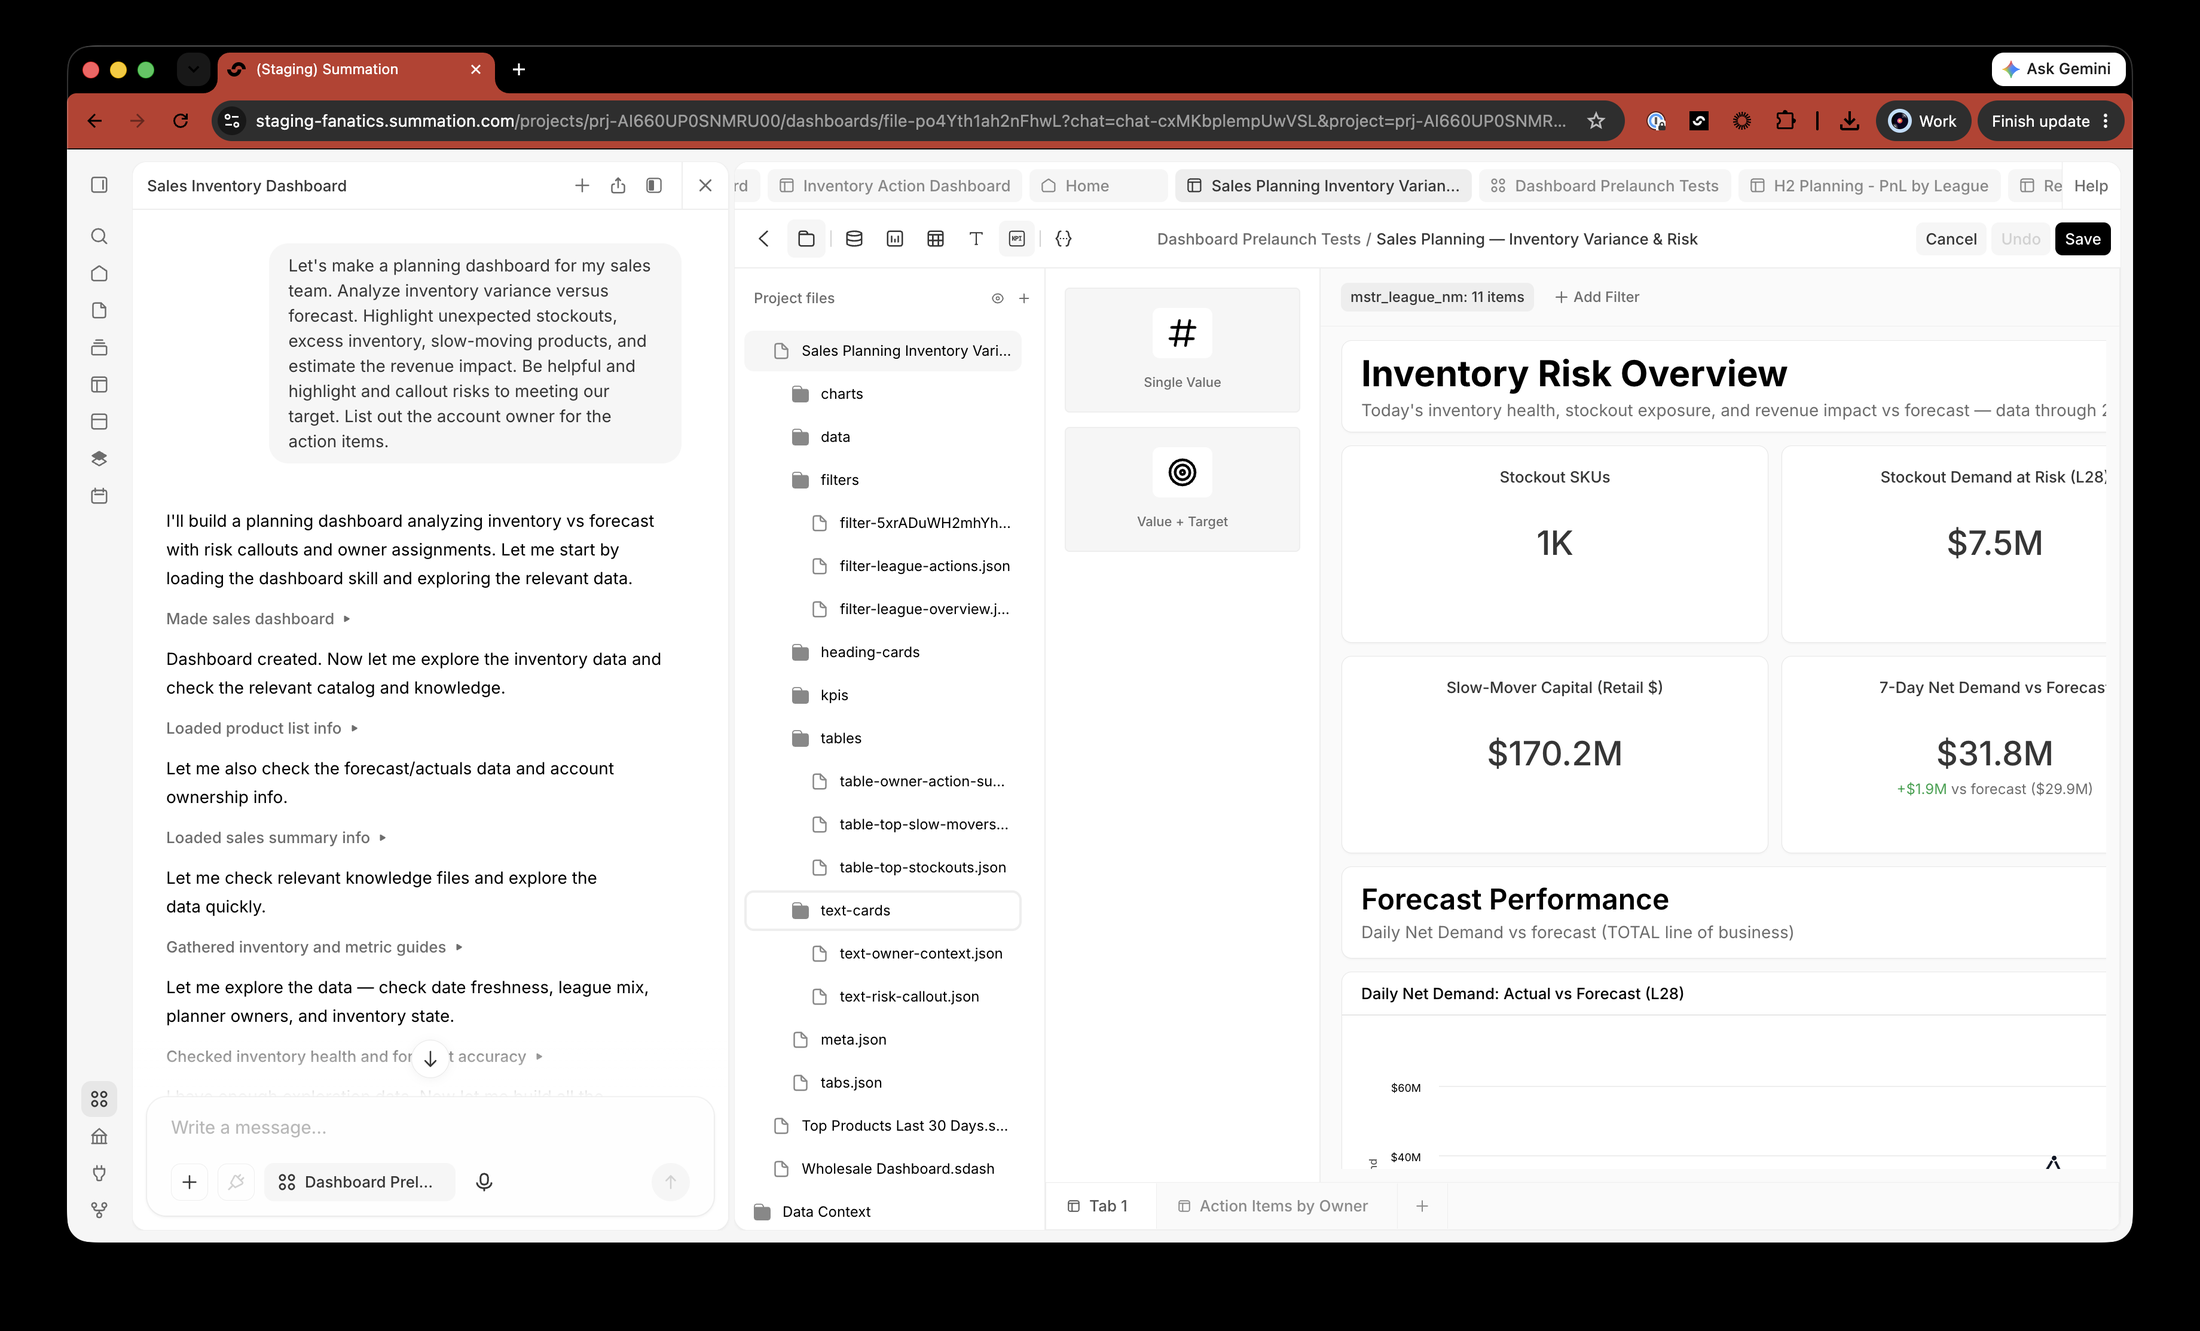
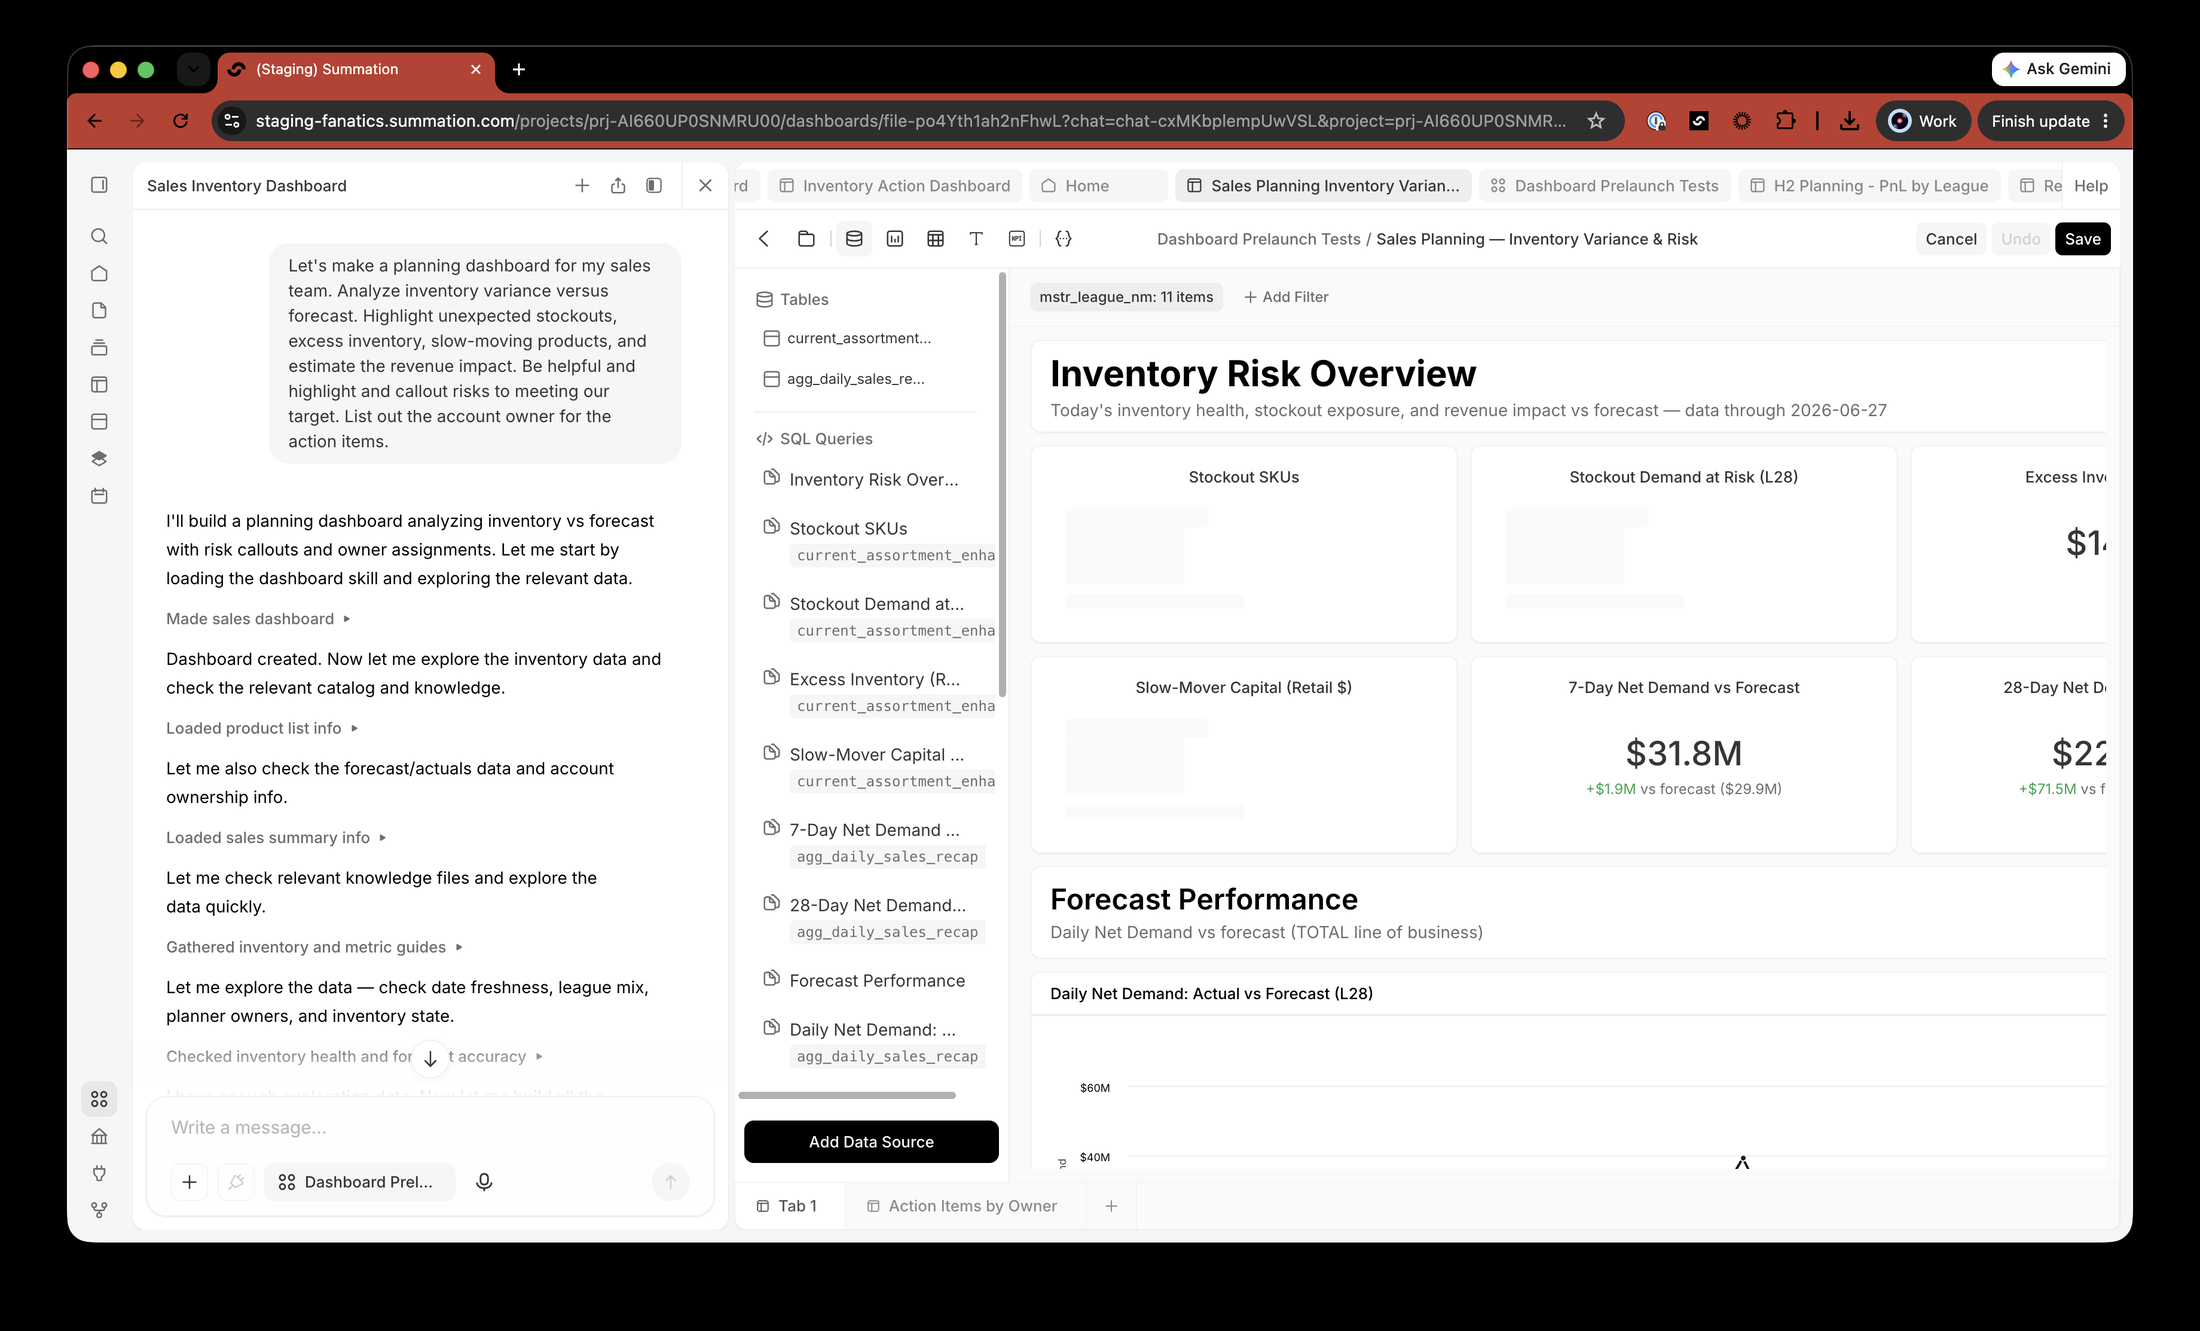
Ask the question, get the dashboard. The agent finds the narrative in the data, plans it into tabs, wires cross-filters and drilldowns, lays out charts with written commentary, and validates the whole thing before it calls itself done. Data stays live. You can then ask the dashboard follow-up questions, holistically or one cell at a time.
What a person gets to touch
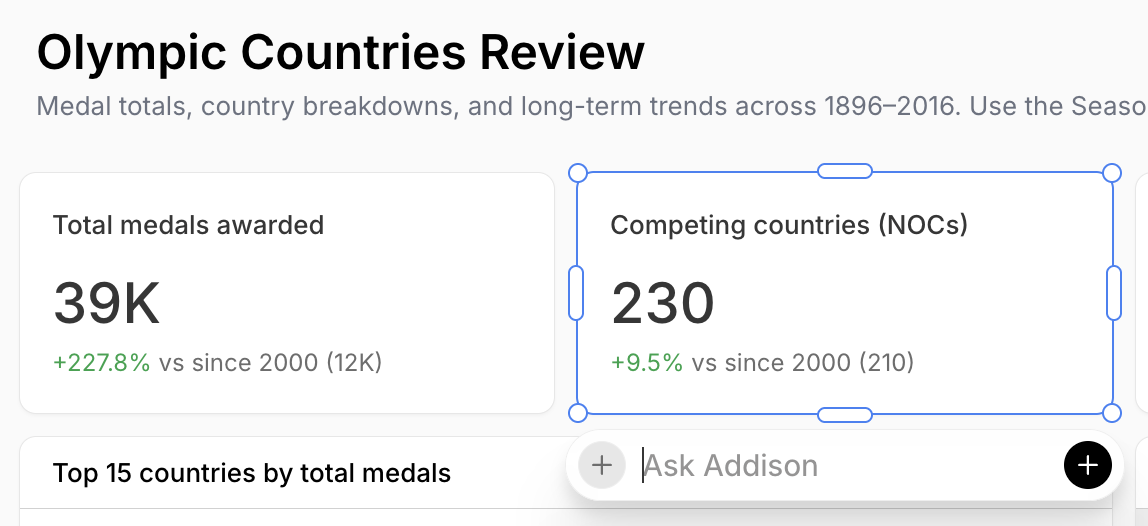
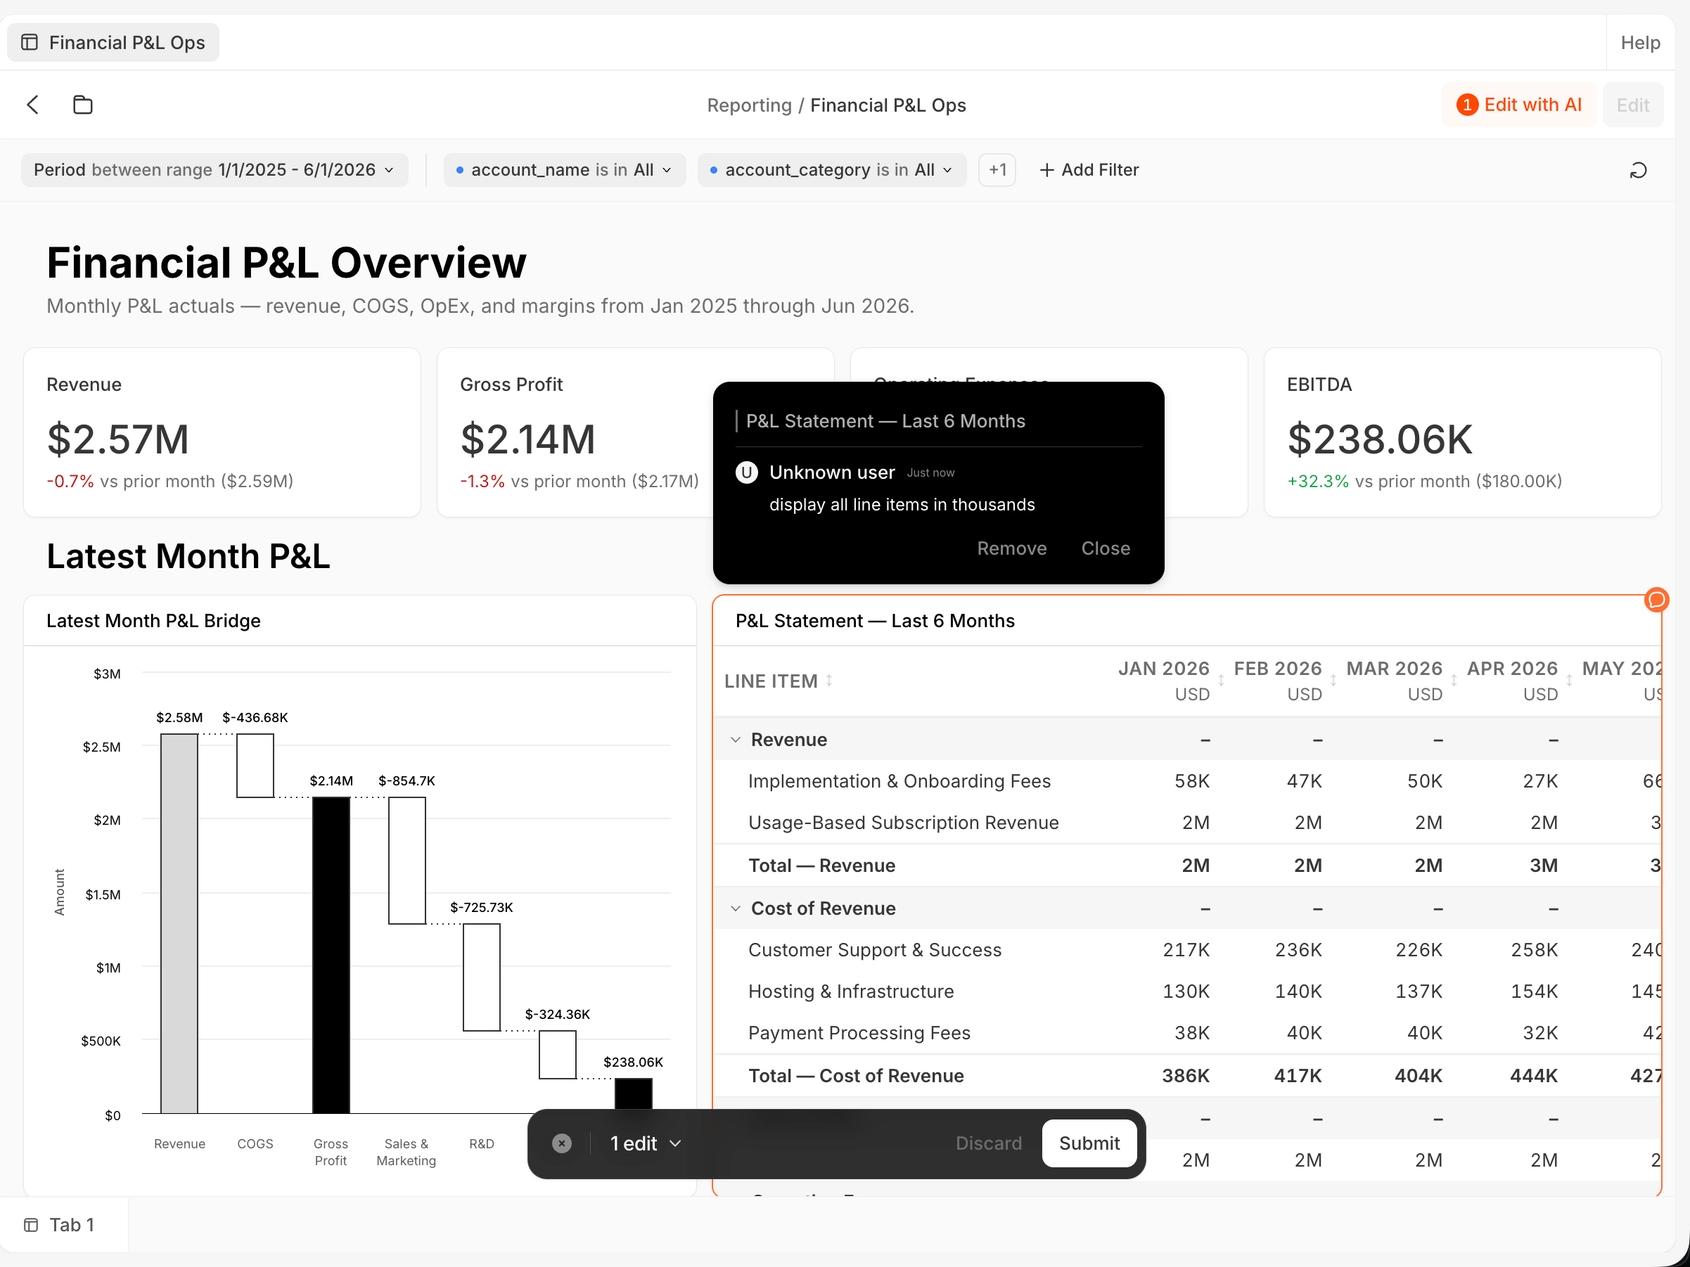
Generation is the first draft, not the last word. Select any card and Ask about it, and the answer streams into the chat pane with that card as context. Or switch to Edit with AI, click the cards you want changed, describe each change, and the edits queue up to go to the agent as a single request. Anything the agent built can also be opened in the editor and changed by hand.
Architecture, in four layers
1. Agentic orchestration
Dashboard composition is decomposed into discrete stages, each backed by a skill carrying its own examples and validators, one per card type. Find the narratives. Plan them into tabs. Assemble the data. Detect column names shared across sources and use them to drive cross-filters and drilldowns. Plot the layout with commentary, as text blocks or as labeled conditional regions inside a chart.
2. One schema, three runtimes
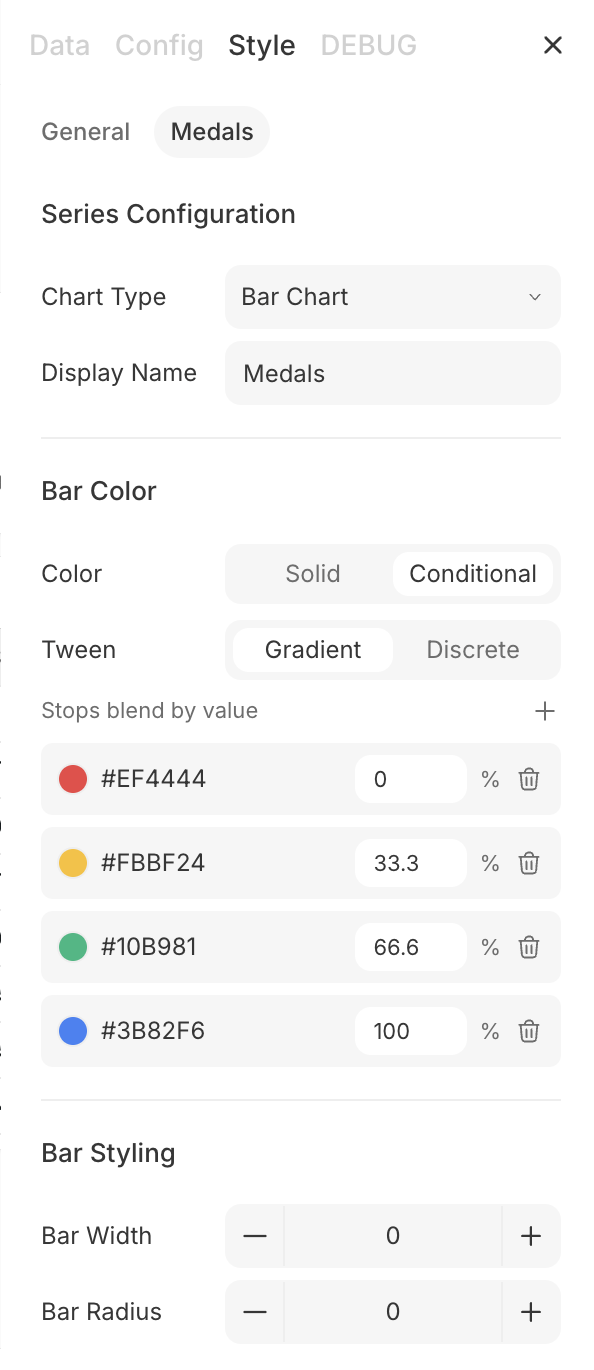
A JSON Schema layer is the single source of truth for what a valid dashboard is. The same contract powers the React editor pane, the Python server-side validators, and the agent's own output checking. Any setting a person can change in the editor, the agent can change too, and neither can produce a state the other rejects.
3. File-per-artifact packaging
Every chart is a file. Every query behind it is a file. The package is hoisted and pulled up on read, so default filters can be coalesced, assembled, and cached ahead of time rather than resolved per widget at render.
4. Rendering and the visual feedback loop
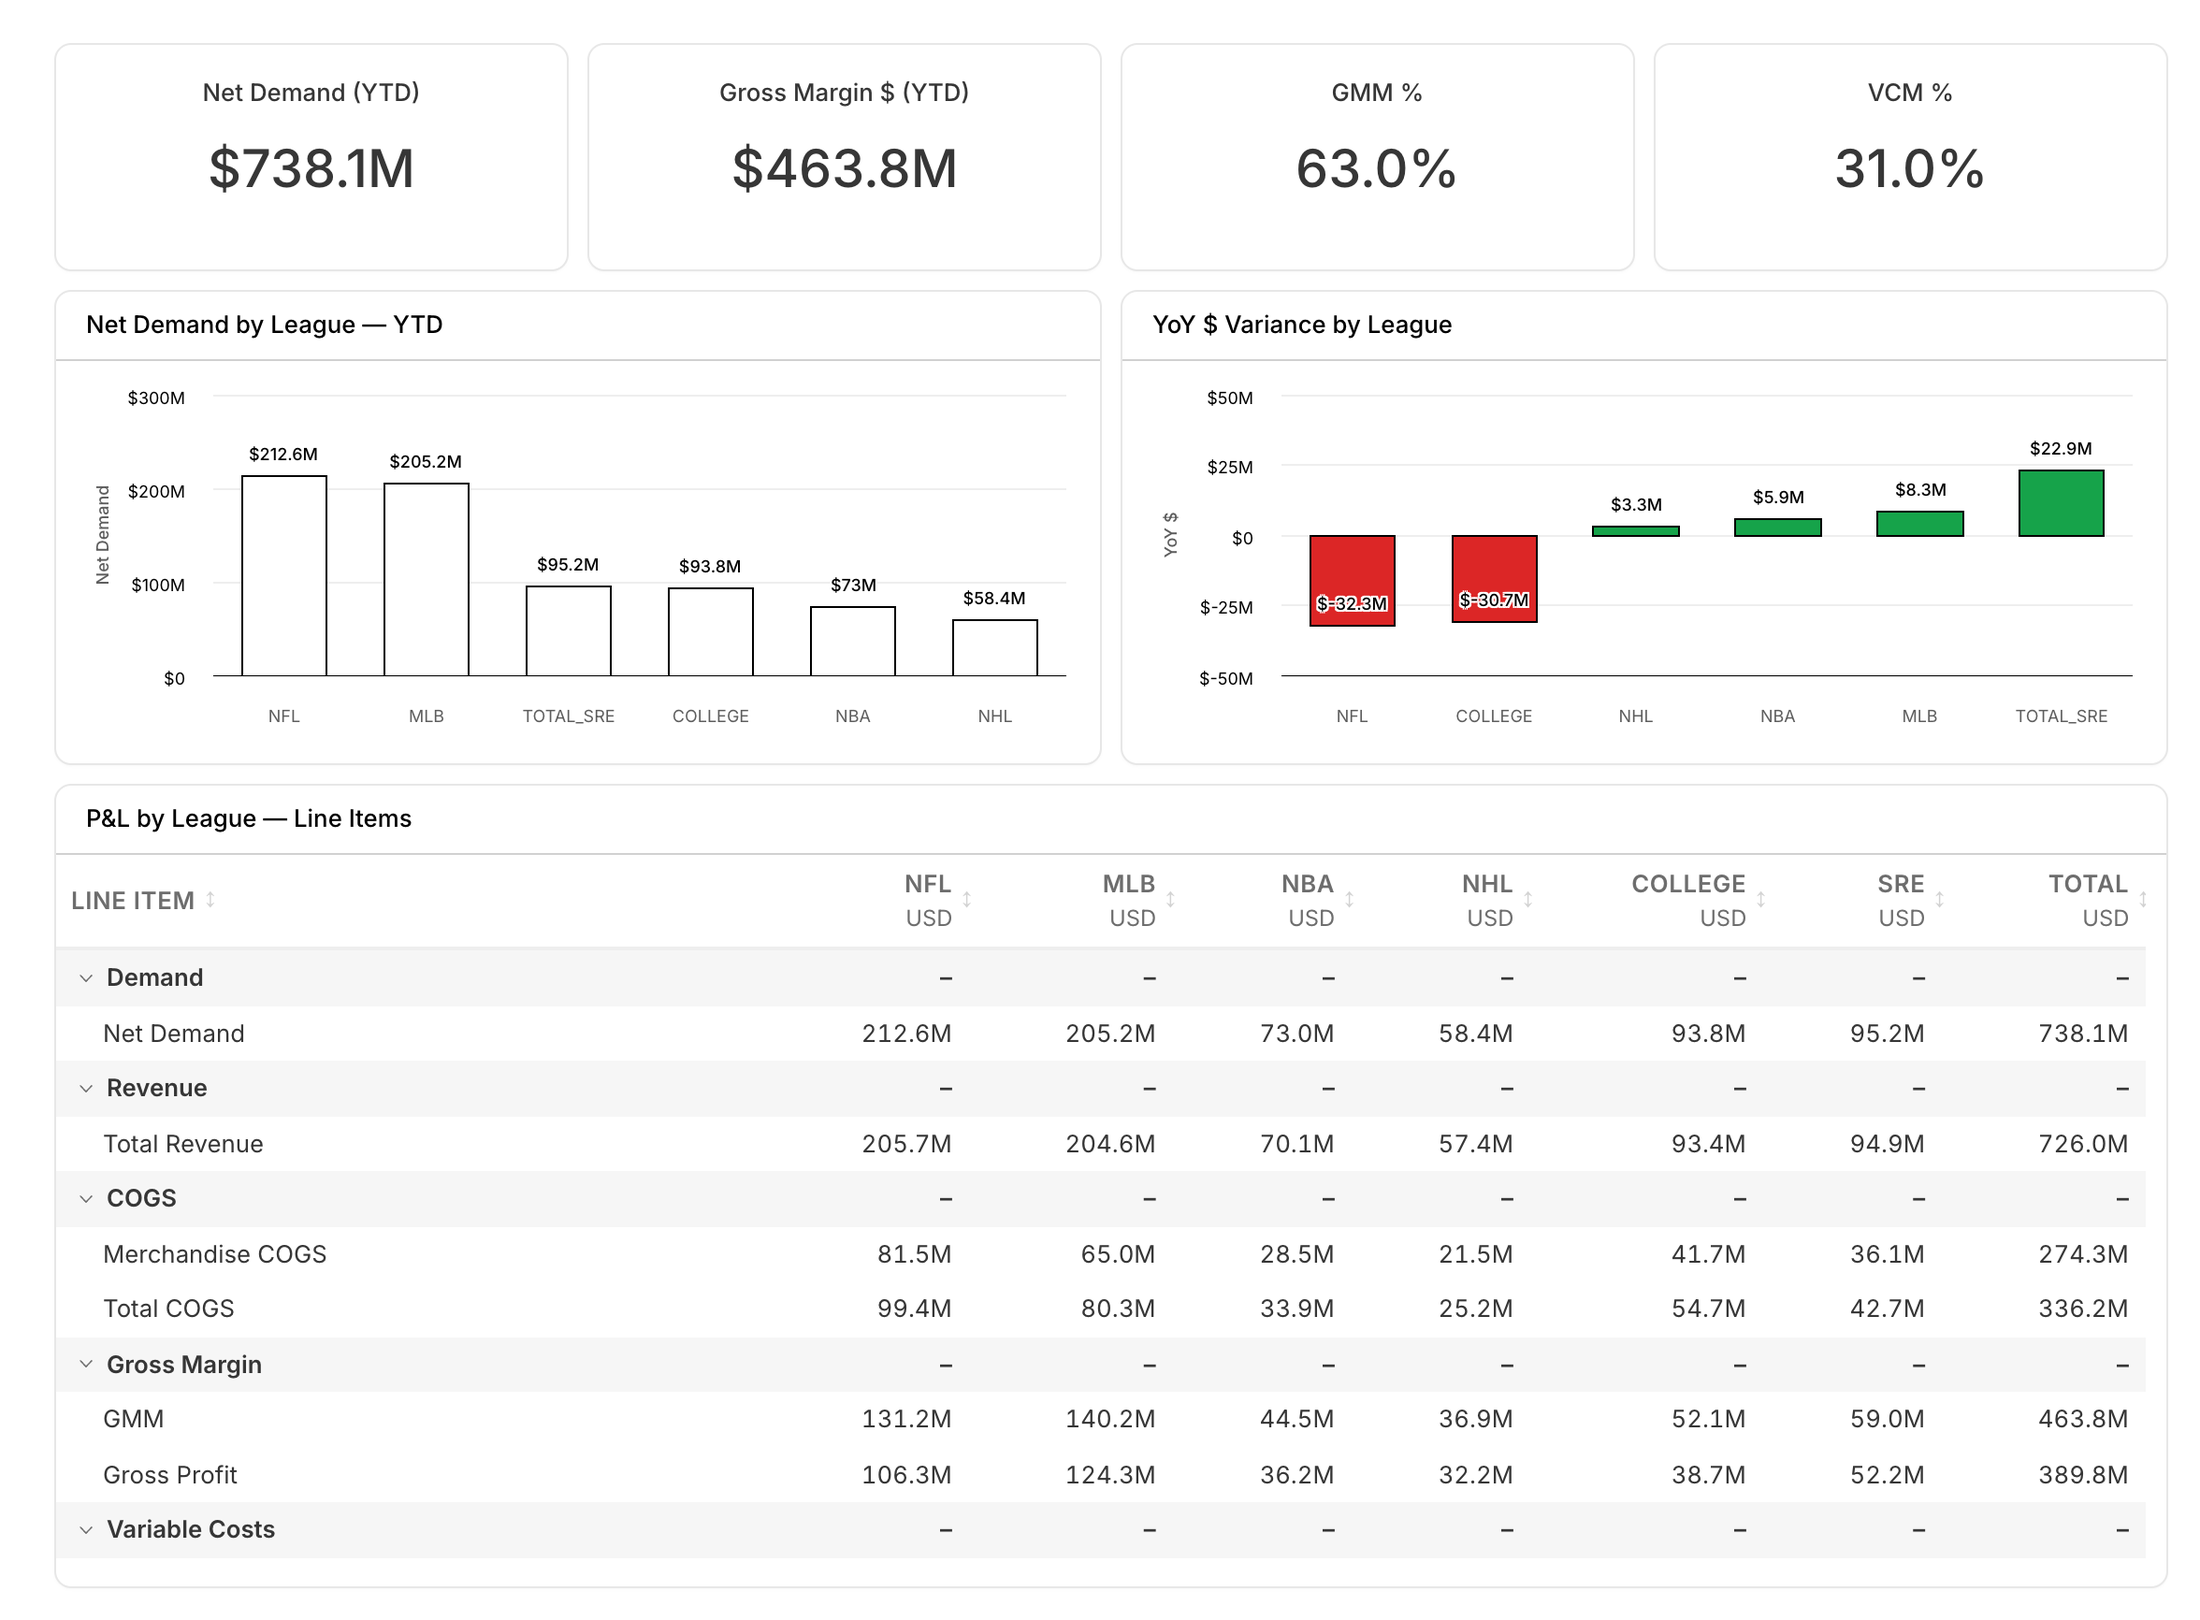
Adapters over Highcharts, ag-Grid powered tables, and fully custom views built on TanStack. The agent gets a base64 render of the chart back, so it can see how the UI actually drew the thing, not just what the validators were willing to call valid configuration.
Filter brokering
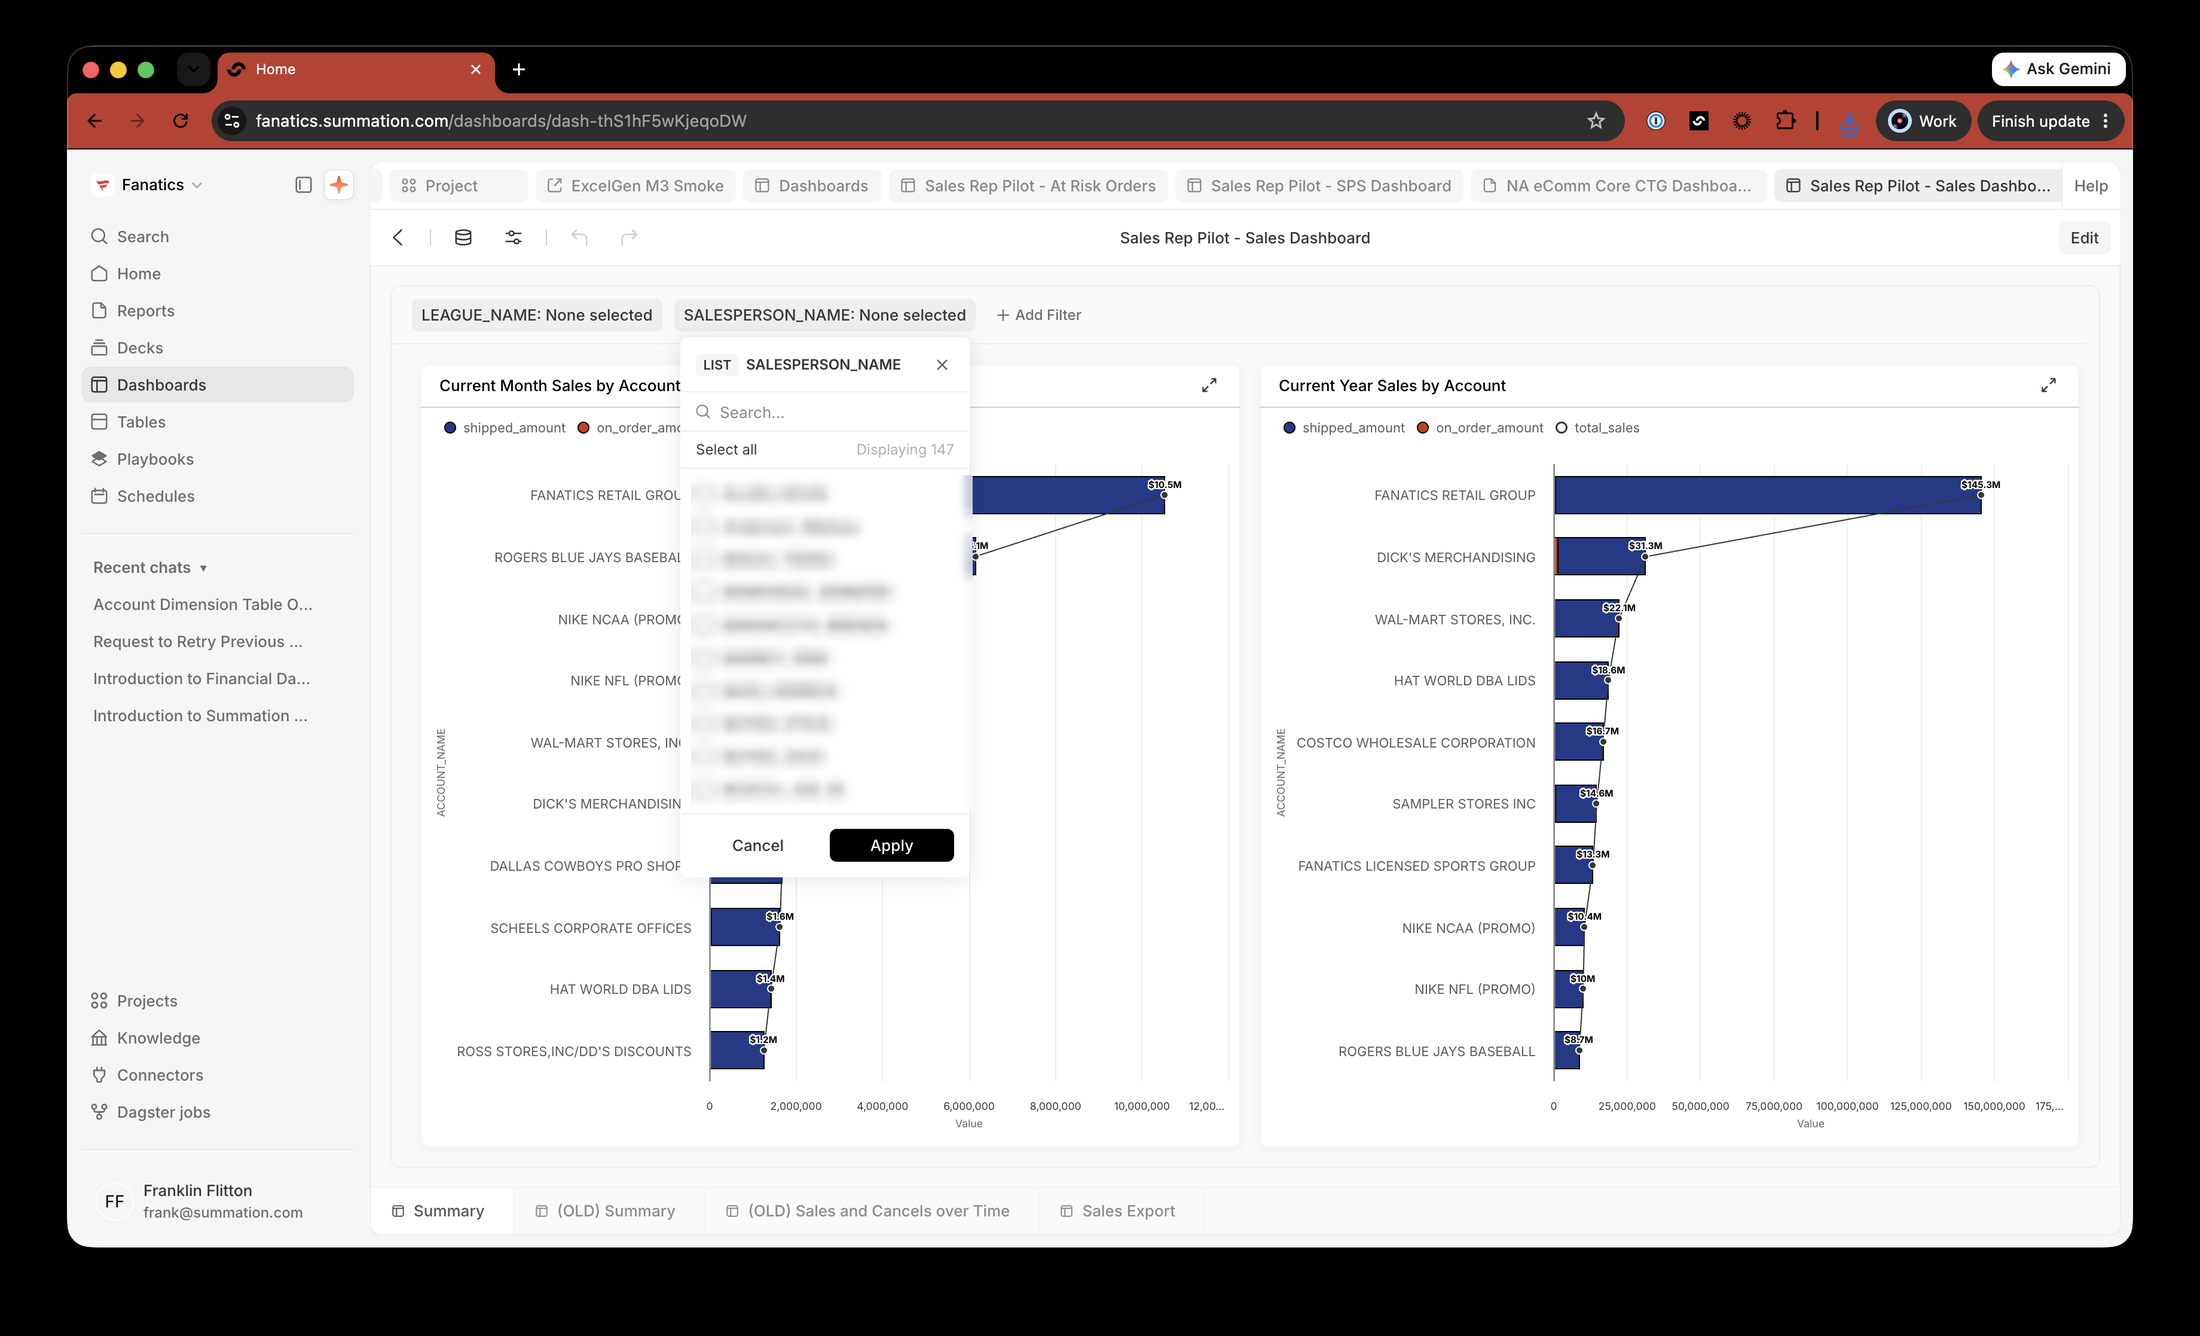
Filters are the part of a dashboard people actually touch, and they were the hardest thing to make correct by construction.
A filter matches on column name — but a column name alone isn't enough to do
anything useful with. Each filter also needs a source table: something to
populate its dropdown from, to enumerate options against, to type its value by.
So the data endpoint takes the set of active filters plus the card's base query
and works backwards. It parses the card's SQL, walks the FROM, JOIN and
alias nodes to resolve which real table each filter column belongs to, and then
coerces the incoming value to that column's actual type. Some values want to
stay strings. Others have to become numbers before a BETWEEN will mean
anything.
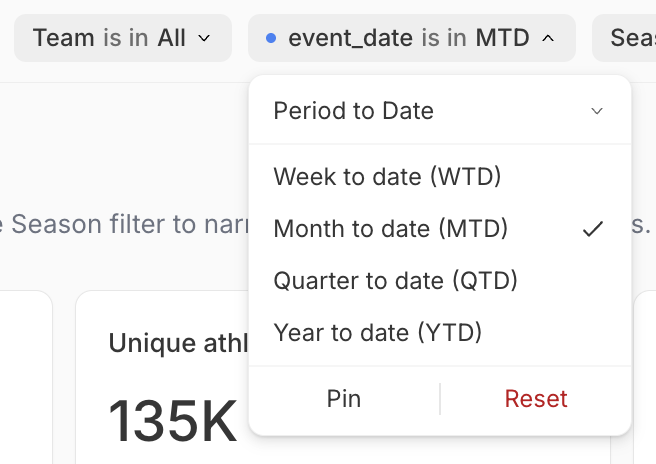
Two rules make the rewrite safe. The filter only attaches when its column is a
genuine base column on a table the card reads directly — a SELECT alias or an
aggregate is invisible to the injection, and quietly does nothing rather than
erroring. And when the card's own SQL already constrains that column, the filter
replaces that predicate instead of AND-ing a duplicate, so a tab-level filter
cleanly overrides a card's built-in default. Cards whose identity is pinned to a
value — a KPI whose title says "2025" — opt into intersect mode instead, so a
mismatched filter returns no rows rather than silently relabelling the card.
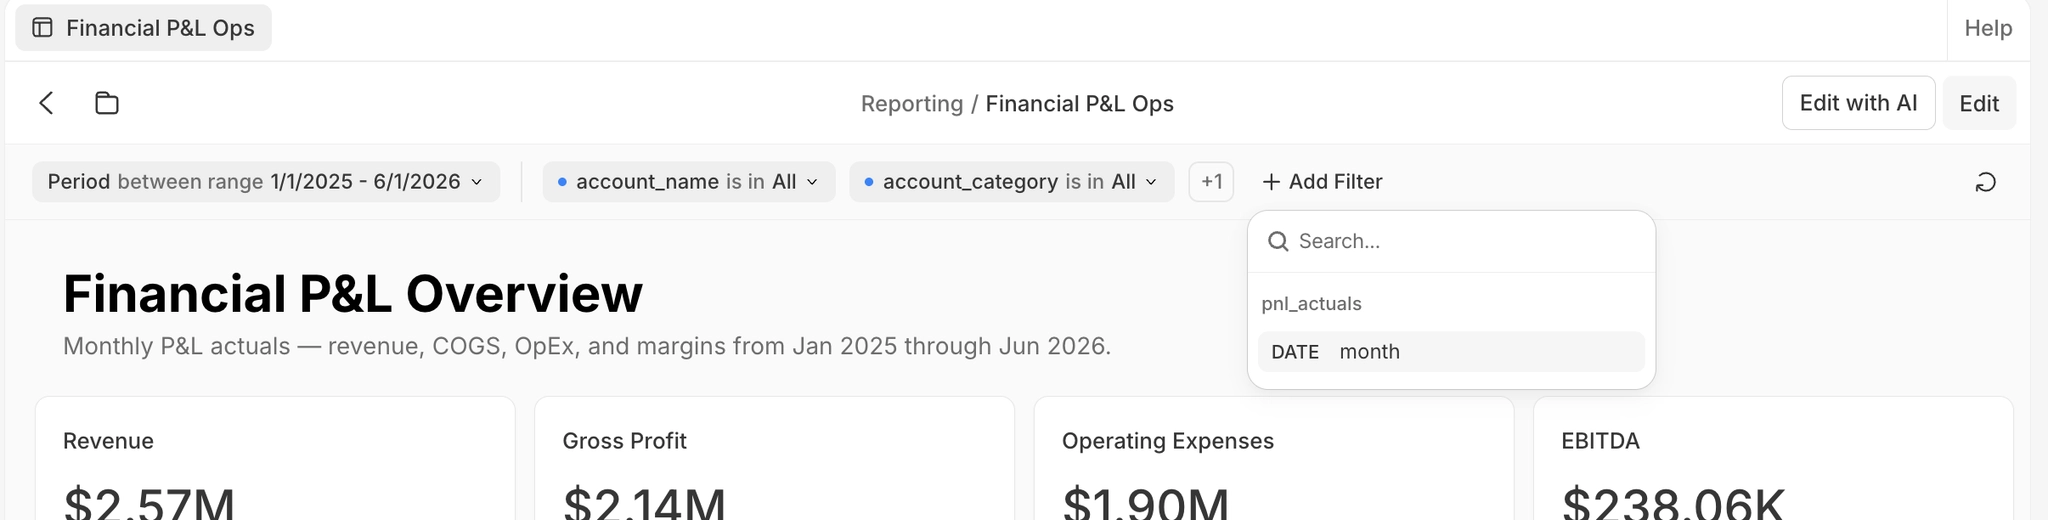
That silent-skip path on the left is the whole reason the rest of the system is strict about flat SQL. A filter that doesn't attach doesn't throw — it returns perfectly plausible, completely unfiltered numbers. The only defence is making it impossible to author one, which is what the validators do.
The hard part
No cell returns an error. The goal was not an agent that generates dashboards, it was a dashboard that is completely correct on the first pass. Every chart, every query, every filter assembles and validates before the agent is permitted to consider the job complete. Shared schema across the React, Python, and agent layers is what makes that enforceable rather than aspirational, and the render feedback loop is what catches the cases where valid configuration still looks wrong.
In practice
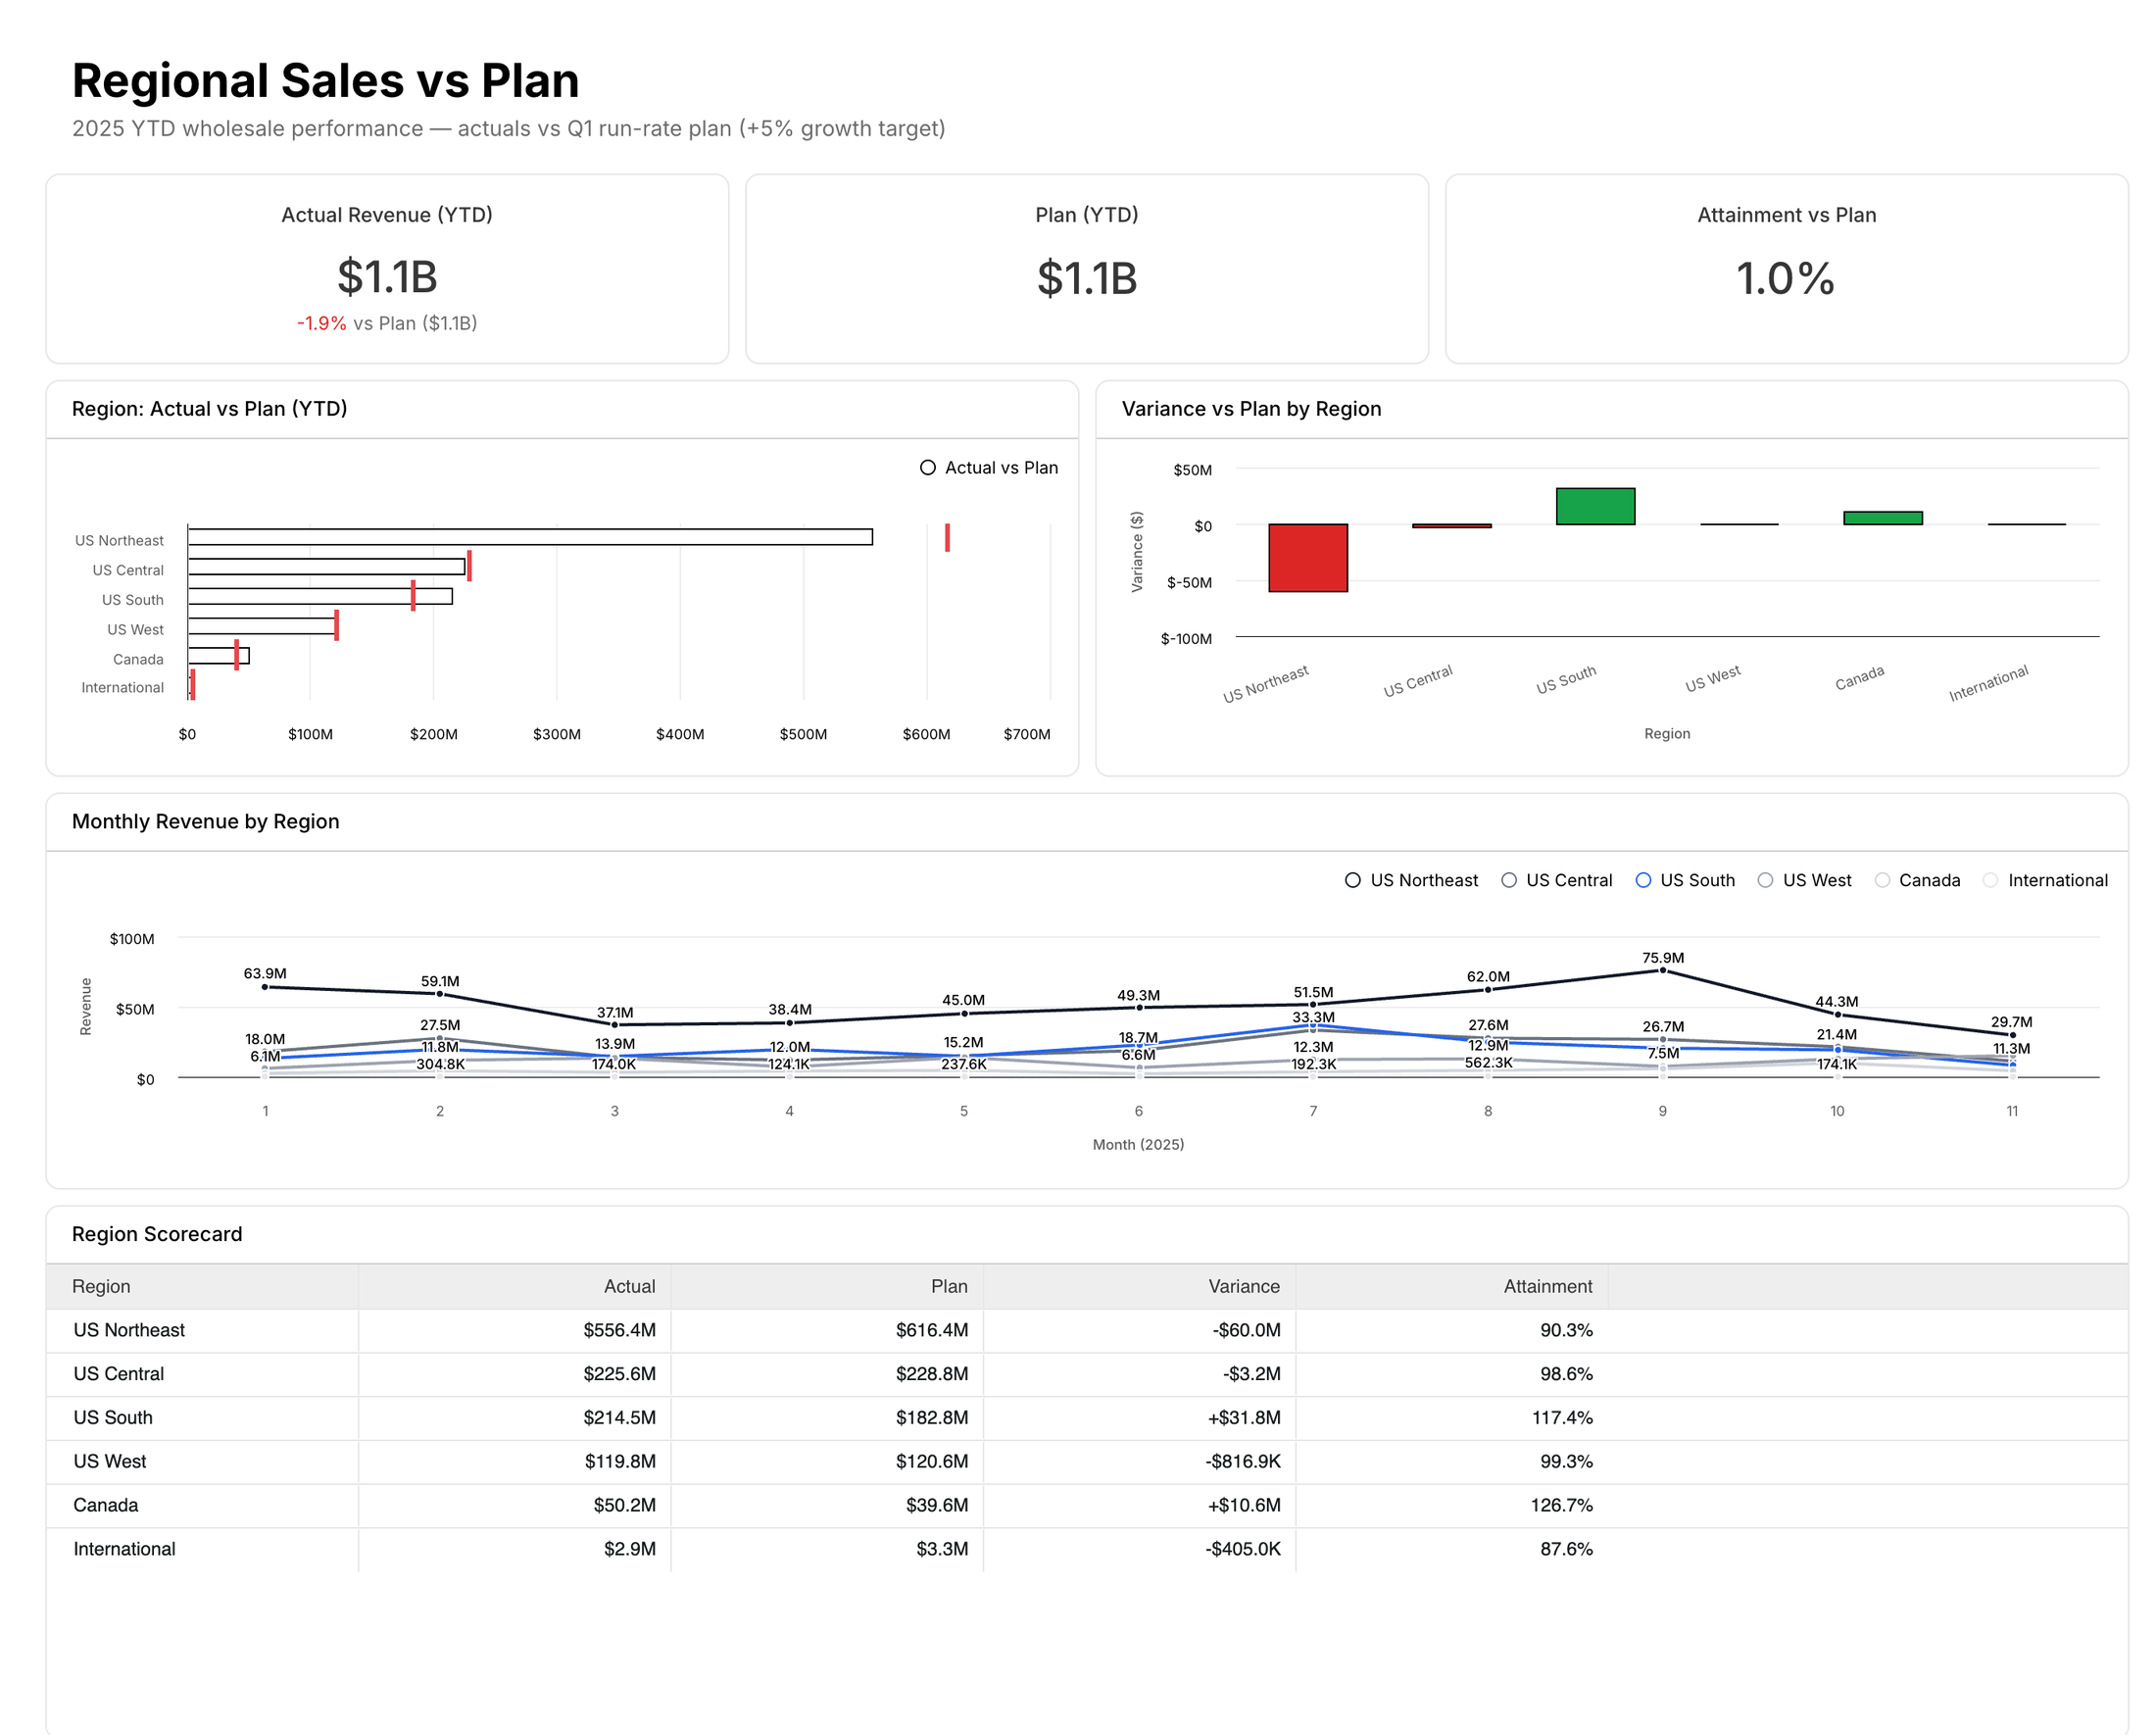
Built with the Fanatics wholesale sales team, with salespeople, warehousing, and inventory cases at the center, extending out to financing and P&L views. The result reads like a Big Four or MBB engagement handed your ops team a Looker workspace, except it takes minutes, refreshes against live data, and answers when you ask it something.
Results
- 100% of customers adopted it.
- 5 to 20 minutes to insight, down from a two-week BI queue.
React, TypeScript, JSON Schema, Python validators, Highcharts, ag-Grid, TanStack, Claude Agent SDK.
All figures shown are synthetic.
The shipped feature set, card by card, is documented in the Summation docs.